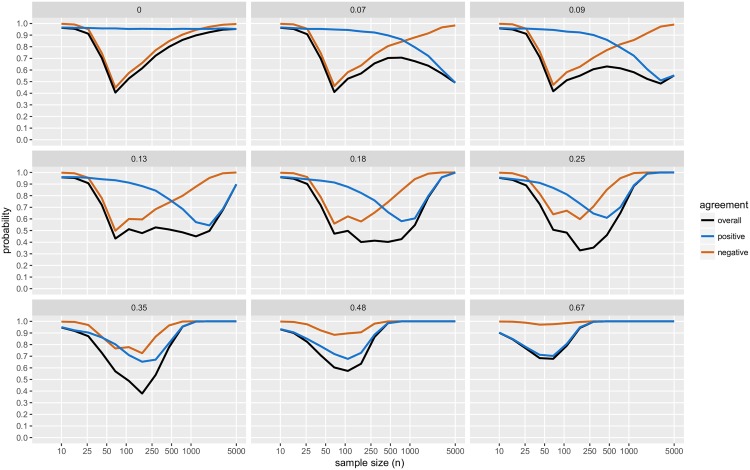
Fig 7. Simulation study results: Levels of agreement; with BF threshold of 6:1.
The black line (“overall”) indicates the probability that the conclusion reached by CET is in agreement with the conclusion reached by the JZS-BF Bayesian testing scheme; with JZS-BF with fixed sample size design, BF threshold of 6:1; and CET with α1 = 0.05, andα2 = 0.10. The blue line (“positive”) indicates the probability that both methods agree with respect to wether or or not a result is positive. The crimson line (“negative”) indicates the probability that both methods agree with respect to wether or or not a result is negative. Each panel displays the results of simulations with true mean difference, μd = 0, 0.07, 0.09, 0.13, 0.18, 0.25, 0.35, 0.48, and 0.67.

