
Fig 1. Blood glucose collected every 30 minutes from 0 to 120 minutes after glucose intake in glucose tolerance test in diabetic rats.
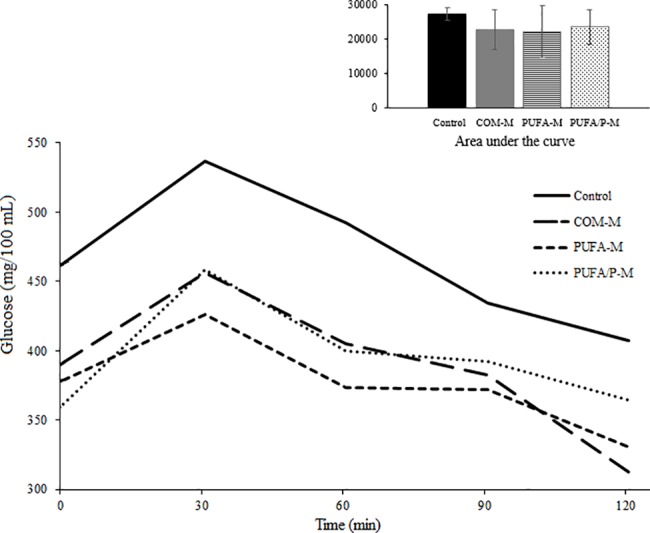
Control = water, COM-M = common milk, PUFA-M = milk enriched with polyunsaturated fatty acids, PUFA/P-M = milk enriched with PUFA and polyphenols. SEM = 11.9; treatment = P = 0.0003; time = P = 0.0008; treatment x time = P = 0.99. Orthogonal contrasts of mean glucose level: P1 < 0.0001, P2 = 0.78, P3 = 0.44. Orthogonal contrasts of area under the curve: P1 = 0.047, P2 = 0.95, P3 = 0.60 (detail); effects tested were: P1 = Control vs. COM-M, PUFA-M, and PUFA/P-M; P2 = COM-M vs. PUFA-M and PUFA/P-M; and P3 = PUFA-M vs. PUFA/P-M.