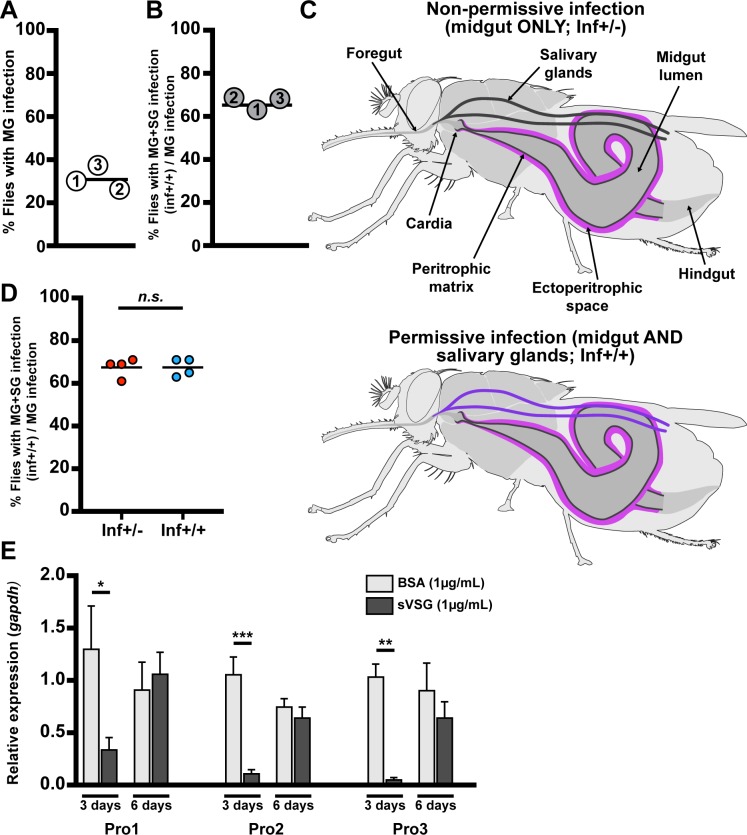
Fig 1. Dynamics of parasite infection in tsetse flies.
(A and B) Midgut (MG) and salivary gland (SG) organs were dissected from 40-day old female flies subjected to a single parasite challenge as newly eclosed adults. (A) Percentage of flies harboring MG infections, and (B) percentage of MG infected flies that also presented SG infections. The numbers in each circle represent the three independent biological replicates. The black bars represent the mean of the three biological replicates (detailed numbers of flies used for the three biological replicates in S1 Dataset). (C) Schematic depiction of trypanosome localization in tsetse fly tissues. In the non-permissive flies (inf+/- state, shown in the upper scheme) only the midgut, including the cardia, is colonized by parasites, which reside in the ES (purple). In permissive flies (inf+/+ state, shown the lower scheme), parasites infect the fly’s and SGs (violet). (D) Percentage of permissive infections (inf+/+) following challenge at teneral stage with parasites obtained from the midgut of either inf+/- or inf+/+ individuals. Four independent experiments were performed for each treatment with 64 infected flies observed in total for each treatment. The black bar represents the mean of the four experiments. SG infection is independent of the initial inf+/- or inf+/+ status of the parasite used for fly infection (GLM, p = 1, detailed model in S1 Dataset). (E) Expression of PM-associated genes proventriculin-1, 2 and 3 (pro1, 2, 3) relative to the housekeeping gene gapdh, three and six days after flies received a blood meal supplemented with 1μg/mL of either BSA (control, light gray) or trypanosome-derived soluble variant surface glycoprotein (sVSG; dark gray). Each bar represents the average (± SEM) of five biological replicates. For each time point of each gene, a Student t-test was used to determine significant differences (* p<0.05; ** p<0.01; *** p<0.001).

