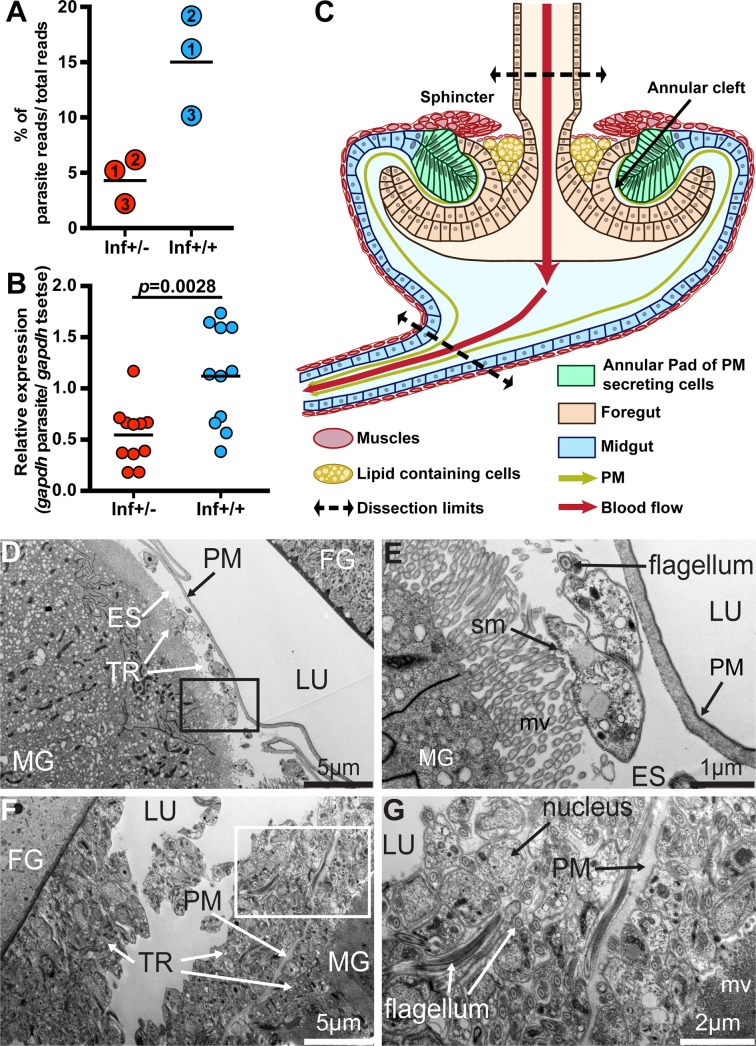
Fig 2. Trypanosome infection establishment process.
(A) Percentage of RNAseq reads, relative to the total, that mapped to the parasite reference geneset from the three independent biological replicates. Inf+/- cardia is depicted in red circles and inf+/+ in blue circles. The numbers in circles represent the three biological replicates. The black bars indicate the mean of the three replicates (detailed numbers of flies used for the three biological replicates in S1 Dataset). (B) Abundance of trypanosome gapdh relative to tsetse gapdh determined from inf+/- cardia (shown by red circles) and inf+/+ cardia (shown by blue circles). The black bars indicate the mean of the replicates. The increase in relative abundance indicates an increase in parasite numbers in the inf+/+ cardia (Student t-test, p = 0.0028). (C) Schematic representation of the cardia organ based on microscopic observations. The cardia is composed of cells originating from the foregut (light orange) and midgut (light blue) at the junction of the foregut and midgut. Specialized midgut cells organized as an annular pad around the invaginated foregut secretes the PM (green) in the annular cleft formed between the foregut and midgut. Sphincter muscles that form a ring above the PM secreting cells, as well as the thin layer of muscle that surrounds large lipid-containing cells (shown in yellow), are indicated. The schematic indicates the upper and lower points where cardia were dissected for all experiments. In this schematic, the crop duct connecting the foregut prior to its invagination in the cardia is not presented. (D-G) Representative TEM micrographs showing cardia from inf+/- (D-E) and inf+/+ (F-G) individuals. (E) and (G) are magnified micrographs of the black and white boxes in (D) and (F), respectively. Cardia from six and five individuals from inf+/+ and inf+/- flies were imaged, respectively. MG: midgut; FG: foregut; ES: ectoperitrophic space; TR: trypanosomes; PM: peritrophic matrix; LU: lumen; mv: microvilli; sm: subcellular microtubules.

