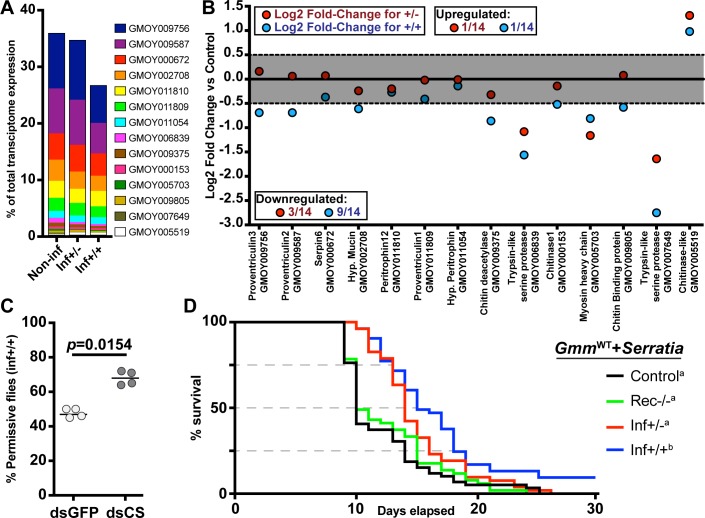
Fig 3. Parasite infection effects on PM synthesis in cardia inf+/+ and inf+/-.
(A) Percentage of transcripts that encode PM-associated proteins, relative to the total number of transcripts in each transcriptome. (B) Differential expression of PM-associated transcripts in cardia of flies that house inf+/+ (blue circles) and inf+/- (red circles) infections. Each dot represents the fold-change in expression of one transcript relative to the non-infected control. The gray area delineates fold-changes that are <1.5, and thus not statistically different from the control cardia (p> 0.05 after FDR correction). For each data point, the Glossina gene ID and function, based on BlastX annotation, is depicted on the x-axis. (C) SG infection prevalence in control (dsRNA-gfp, dsGFP) and treatment (PM compromised; dsRNA-chitin synthase, dsCS) flies. The circles depict the percentage of flies that harbor both gut and SG infections. A total of four independent experiments were set-up for each group. The black bars indicate the mean of the four experiments. A total number of 66 and 63 infected flies were observed in the dsGFP and dsCS treatments, respectively. The dsCS treatment significantly increases trypanosome infection prevelance in tsetse’s salivary glands (GLM, Wald-test p = 0.01408). Detailed counts and a complete statistical model are indicated in S1 Dataset. (D) Effect of cardia inf+/- and inf+/+ extracts on PM integrity. Survival of flies was monitored daily after per os treatment of 8 day-old flies with cardia extracts followed by per os treatment with Serratia marcescens 72 hours later. The Kaplan-Meyer curves show fly survival over time: cardia inf+/- (red), cardia inf+/+ (blue), or cardia from flies that recovered from infection (rec-/-, green) and cardia non-inf (black). Statistical analysis was performed using a full regression model followed by a pairwise test (details in S1 Dataset). Different letters next to fly group designations in the figure legend represent significantly different curves (p< 0.05).

