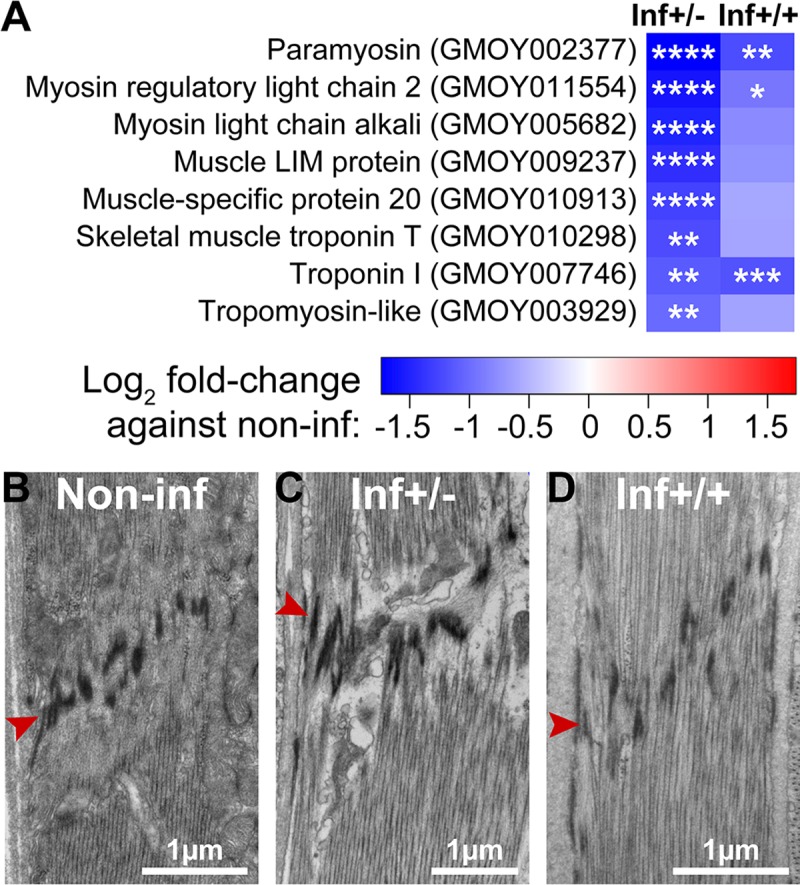
Fig 7. Muscle structural integrity in cardia from inf+/+ and inf+/-.

(A) Effect of infection on cardia muscle related gene expression. Heatmap generated from the fold-changes between control and either inf+/- or inf+/+ cardia. The * denote the level of significance associated with the DE of specific transcripts (*p<0.05; **p<0.01; ***p<0.001; ****p<0.0001). (B-D) Ultrastructure of a sarcomere from muscles surrounding non-inf (B), inf+/- (C) and inf+/+ (D) cardia. The red arrowhead indicates the Z band structure associated with sarcomeres. Micrographs in this image represent one of three, five and six of biological replicates from cardia non-inf, inf+/- and inf+/+, respectively.
