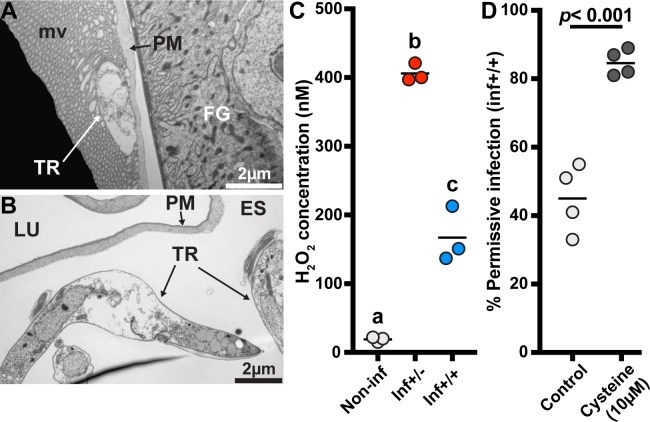
Fig 8. Influence of oxidative stress on infection status.
(A-B) Electron microscopy observations of trypanosomes presenting cell-death swelling within the ES of cardia from inf+/- flies. Micrographs in this image represent two of five of biological replicates. FG: foregut; TR: trypanosomes; PM: peritrophic matrix; LU: lumen. (C) Comparison of peroxide levels in cardia from non-infected (white circles), inf+/- (red circles) and inf+/+ (blue circles) flies 72 hours after a blood meal. Each dot represents an independent quantification of 10 pooled cardia. The black bars indicate the mean of the 3 replicates. Statistical analysis was conducted using a one-way ANOVA followed by a TukeyHSD posthoc test for pairwise comparisons. Statistical significance is represented by letters above each condition, with different letters indicating distinct statistical groups (p< 0.05). (D) SG infection prevalence in normal and anti-oxidant (cysteine) treated flies. The circles depict the percentage of flies that harbor both gut and SG infections in the cysteine treated (10μM) and control groups. A total of 4 independent groups were set-up for each treatment (91 and 89 infected flies were observed in the control and cysteine treatment groups, respectively). The black bars indicate the mean of the 4 experiments. Cysteine treatment significantly increases trypanosome infection prevelance in tsetse’s salivary glands (GLM, Wald-test p<0.001). Detailed counting data and complete statistical model are indicated in S1 Dataset.

