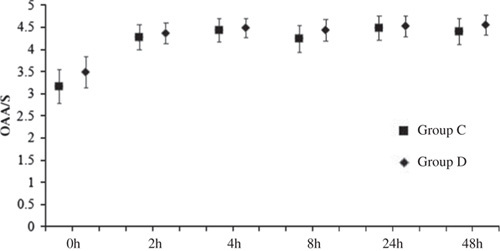
FIGURE 6.

OAA/S scores (mean [95% CI]). The OAA/S scores at each timepoint have no significant difference between groups. P-value (time×group >0.05) for differences between the groups C and D over the 48-hour study period (mixed-effects models). CI indicates confidence interval; OAA/S, observer’s assessment of alertness/sedation. P>0.05 group D compared with the group C (Tukey-Kramer-adjusted).
