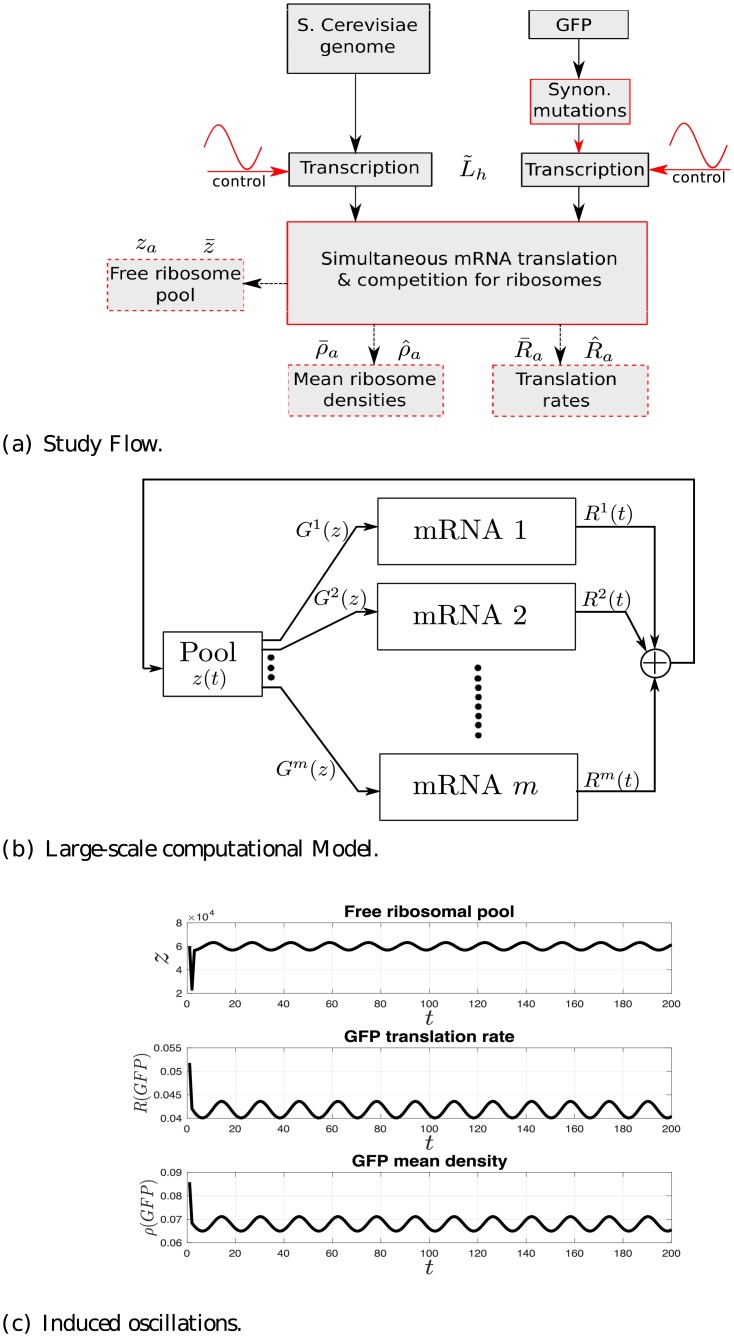
Fig 1. Overview of the study and the model.
(a) Study flow diagram. Red color indicates blocks/functions simulated in this study. Dashed blocks specify measurements. Variables correspond to mRNA levels () and various measurements (). See the main text for details. (b) Topology of the computational model used in this study, which includes m mRNAs and a shared free pool of ribosomes. Gi(z) denotes the initiation rate to mRNA i, and Ri(t) denotes the translation rate of mRNA i at time t. (c) An example of the free ribosomal pool (top), the GFP translation rate (middle) and the GFP mean ribosomal density (bottom) as a function of t ∈ [0, 192] for a periodically varying GFP mRNA levels with period T = 16.

