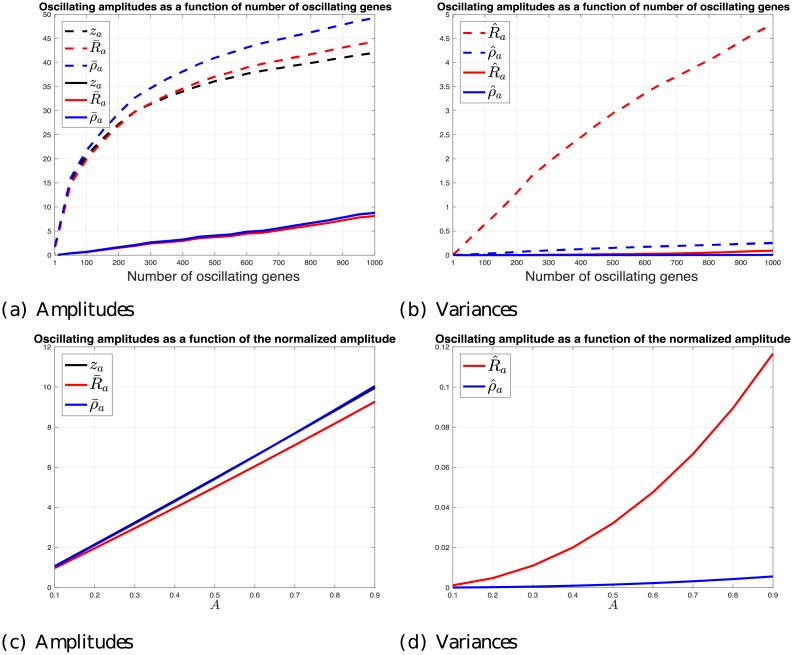
Fig 2. The effect of endogenous gene mRNA levels.
(a) za, , and as a function of the number of oscillating genes chosen incrementally from a mRNA levels-sorted list of genes (see details in the Materials and methods section), (dashed-line), and genes chosen randomly from the gene list (solid-line), for A = 1/2. Note that the results for za and when oscillating a typical gene set are very similar (the solid-line for za cannot be distinguished from the solid-line ) (b) The corresponding variances. (c) za, , and as a function of the normalized amplitude A ∈ [0.1, 0.9] when oscillating the cell cycle related genes. (d) The corresponding variances.

