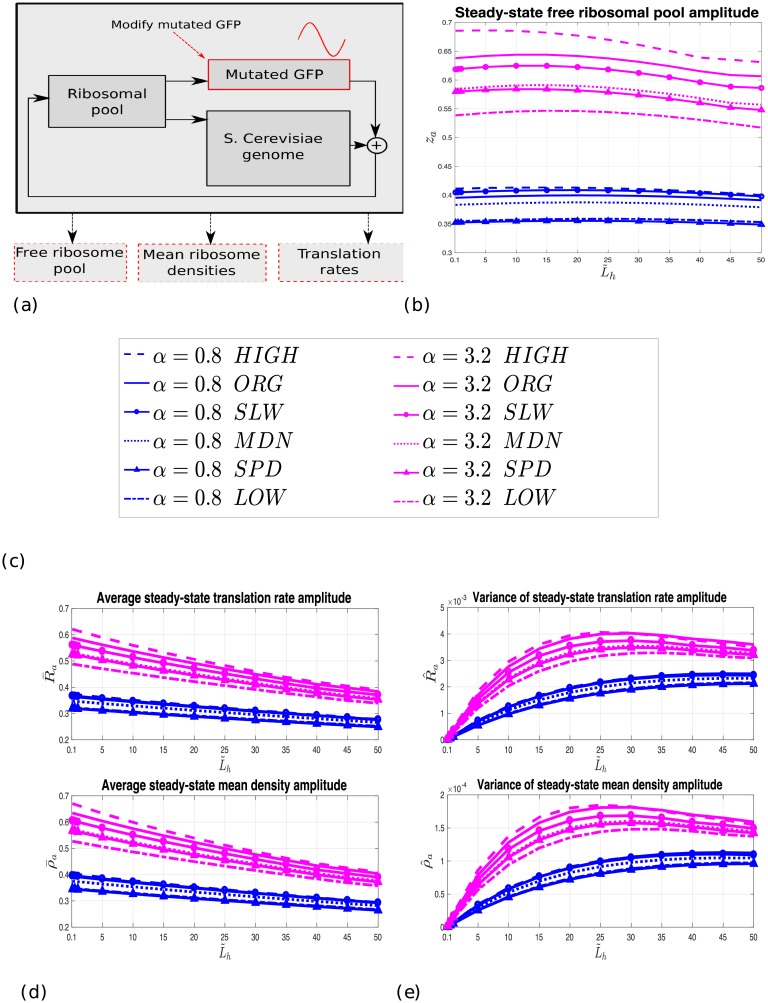
Fig 4. The effect of heterologous gene mRNA levels and elongation rates.
(a) Block diagram of the current test. (b) Normalized za as a function of , α = 0.8 and α = 3.2 for A = 1/2, T = 16, and . “ORG” denotes the original (non-mutated) GFP. (c) Legend of the sub-figures. The up-to-down order corresponds to the performance ranking, per value, in sub-figures (b), (d), and (e), i.e. HIGH results in the largest measurement values, followed by ORG, etc. (d) Normalized (upper figure) and normalized (lower figure) as a function of , α = 0.8 and α = 3.2 for A = 1/2, T = 16, and . (e) Normalized (upper figure) and normalized (lower figure) as a function of , α = 0.8 and α = 3.2 for A = 1/2, T = 16, and .

