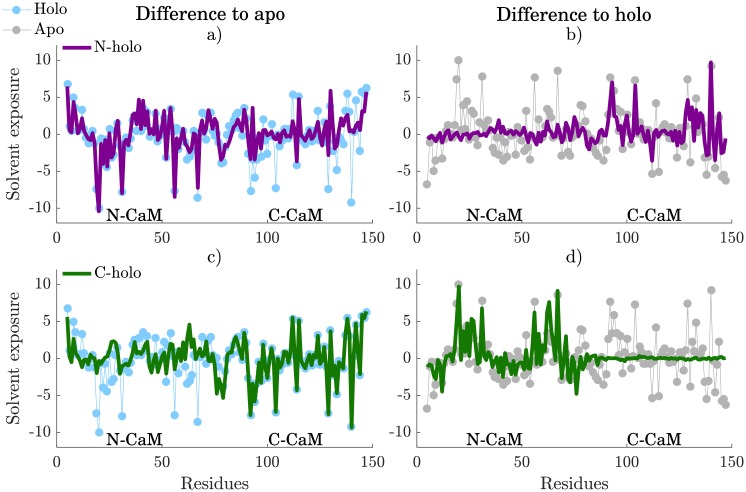
Fig 7. Solvent exposure difference of N-holo (purple) and C-holo (green) to a, c) apo and b,d) holo.
The difference in solvent exposure to holo of both N-holo and C-holo are compared to the solvent exposure difference of apo (gray) to holo, while the difference in solvent exposure to apo of the two are compared to the solvent exposure difference of holo (blue) relative to apo.

