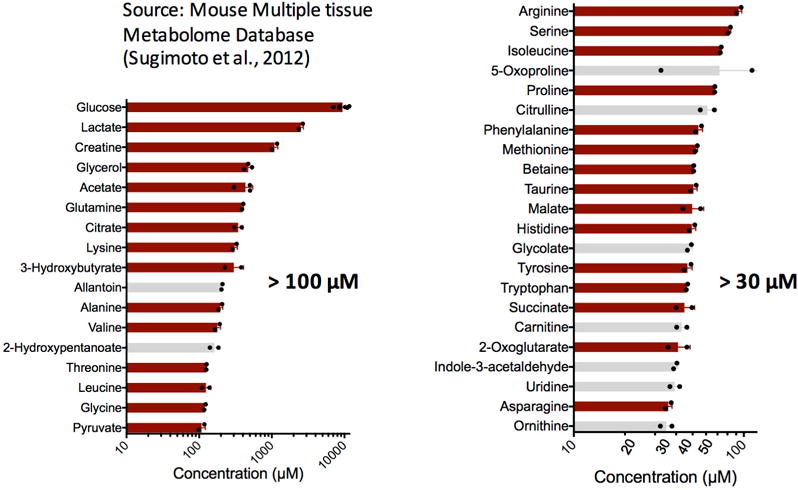
Extended Data Figure 1. Abundant metabolites in mouse plasma.

Metabolites (n = 39) with reported concentration greater than 30 μΜ in mouse plasma. Left bar graph shows those >100 μM (n = 17) and right bar graph those between 30 μM and 100 μM (n = 22). Most of the data are from the Mouse Multiple Tissue Metabolome Database (http://mmdb.iab.keio.ac.jp) (n = 2 mice), except for glucose (n = 6 mice), acetate (n = 3 mice), and glycerol (n = 3 mice), whose concentrations were determined in this study. The metabolites shown with red bars (n = 30) are those whose turnover fluxes have been determined (Table 1). Values are mean ± s.d. The concentration cut off of 30 μM was calculated using equation (1) where we used a cardiac output of 0.5 ml g−1 min−1 (see Supplementary Note 1 for references) and a turnover flux equating to 10% of glucose Fcirc.
