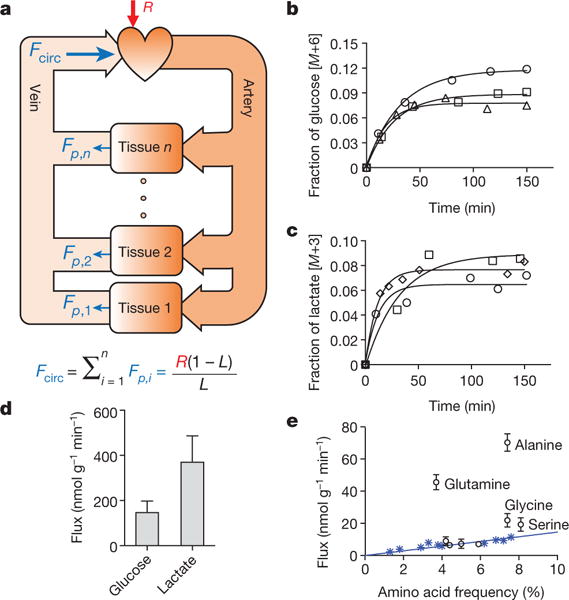
Figure 1. Turnover fluxes of circulating metabolites in fasting mice.

a, Illustration of circulatory turnover flux (Fcirc) and its determination by isotope tracing. b, c, Kinetics of isotopic labelling of circulating glucose and lactate. Data from different mice are indicated by different symbols and are fitted with a single exponential. d, Glucose (n = 22) and lactate (n = 24) turnover fluxes; data are mean ± s.d. e, Turnover fluxes of amino acids versus their average abundances in mammalian proteins. Blue asterisks, essential amino acids (EAAs). Data are mean ± s.d.; n = 5 for glutamine; n = 4 for essential amino acids except tyrosine; n = 3 for other amino acids). In all figures, n = number of mice.
