
Extended Data Figure 2. Determination of turnover flux with isotopic tracing.
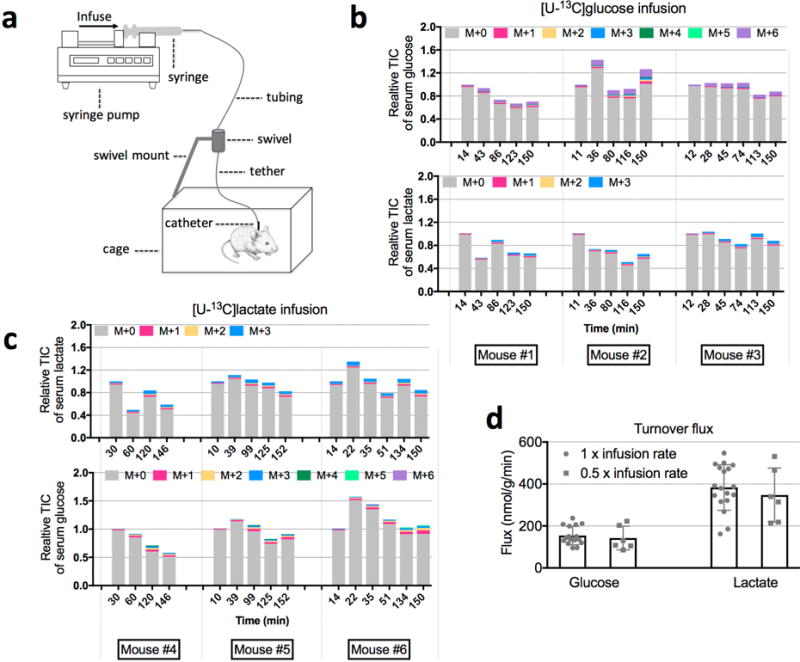
a, Illustration of the mouse infusion experimental setup. b, Relative total ion counts (TICs) of serum glucose and lactate during 13C-glucose infusion (individual mouse data are shown for three mice for each condition). c, Relative TICs of serum glucose and lactate during 13C-lactate infusion. d, Glucose (n = 16 for 1 × and n = 6 for 0.5 ×; P = 0.61) and lactate (n = 18 for 1 × and n = 6 for 0.5 ×; P = 0.50) turnover fluxes determined using two different infusion rates (mean ± s.d.). P values were determined by a two-tailed unpaired Student’s t-test. The 1 × infusion rates are listed in Supplementary Table 1.