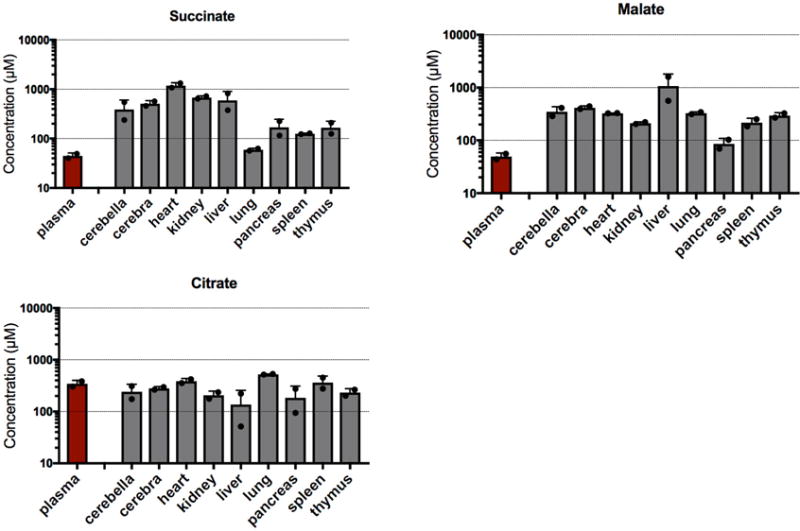
Extended Data Figure 6. Concentrations of succinate, malate, and citrate in mouse plasma and tissues.

Unlike citrate, succinate and malate have substantially higher concentrations in tissues than in the bloodstream, thus making them a suitable readout for the tissue TCA cycle. Data are from the Mouse Multiple Tissue Metabolome Database (http://mmdb.iab.keio.ac.jp). Values are mean ± s.d. (n = 2 mice). Note that the y-axis is a logarithmic scale.
