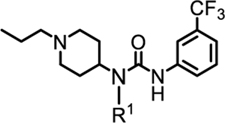
Table 2. Optimization of the Leu pocket.
Values for the TR-FRET, solubility, and permeability experiments are represented as means plus or minus standard deviation calculated from at least one experiment, run in triplicate. ND indicates values were not determined.

| |||||||||
|---|---|---|---|---|---|---|---|---|---|
|
| |||||||||
| No | R1 | IC50 (μM) (TR-FRET) | Avg. Sol (μM) | Pampa (×10−6 cm/s) | No | R1 | IC50 (μM) (TR-FRET) | Avg. Sol (μM) | Pampa (×10−6 cm/s) |
| 35 |
|
10 ± 1.2 | 61 ± 3.1 | 1600 ±170 | 41 |
|
0.75 ± 0.26 | 69 ± 1.4 | >2200 |
| 36 |
|
1.4 ±0.23 | 70 ± 2.3 | >2200 | 42 |
|
0.82 ± 0.36 | 39 ± 2.9 | 1800 ± 1 |
| 37 |
|
5.8 ± 1.3 | 96 ± 9.7 | 1900±200 | 43 |

|
1.3 ±0.25 | <0.1 | 1300 ±79 |
| 38 |
|
2.7 ± 0.29 | 61 ± 3.7 | 1500 ±5.4 | 44 |
|
4.2 ±0.38 | 85 ± 2.7 | 700 ± 73 |
| 39 |
|
21 ±3.8 | 64 ± 7.6 | 1600 ± 1 | 45 |
|
> 1.1 ±0.12 | 66 ± 4.2 | >2200 |
| 40 |

|
2.4 ±2.4 | 90 ± 12 | >2200 | 46 |

|
1.0 ±0.53 | 37 ± 2.4 | >2200 |
