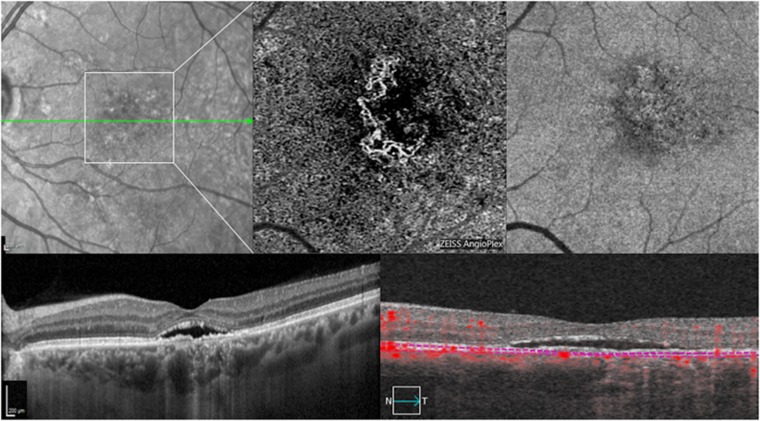
Figure 4.
Infrared reflectance (IR), optical coherence tomography (OCT), and OCT-angiography (OCT-A) of the same patient of Figure 3 at 13-week follow-up. (First panel) IR and structural OCT B-scan passing through the fovea showing the persistence of macular serous retinal detachment and the presence of a hyperreflective area between the Bruch’s membrane and the irregularly elevated retinal pigment epithelium. (Second and third panel) Choriocapillaris segmentation on 3 × 3 OCT-A, corresponding en-face OCT and B-scan with flow showing still the persistence of CNV.

