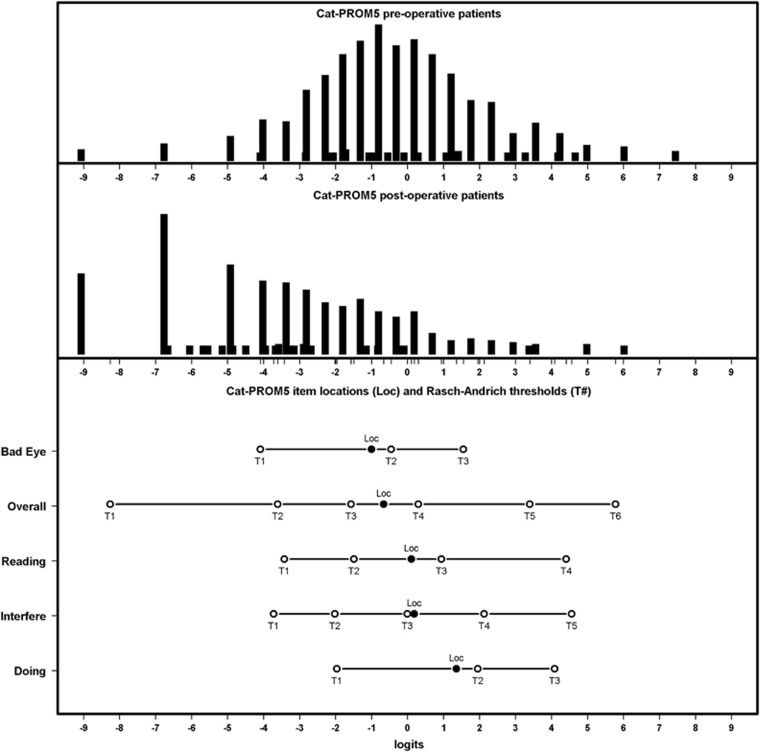
Figure 2.
Cat-PROM5 Person-Item map for all cycles showing respondent distributions for pre-operative (upper panel), post-operative (middle panel) completions, and the Item Locations (Loc) and Thresholds (probability crossover points between adjacent categories, lower panel) on the same Logit scale. In total, 1266 questionnaire completions were available. Pre- and post-operative means −0.41 and −3.61 respectively.

