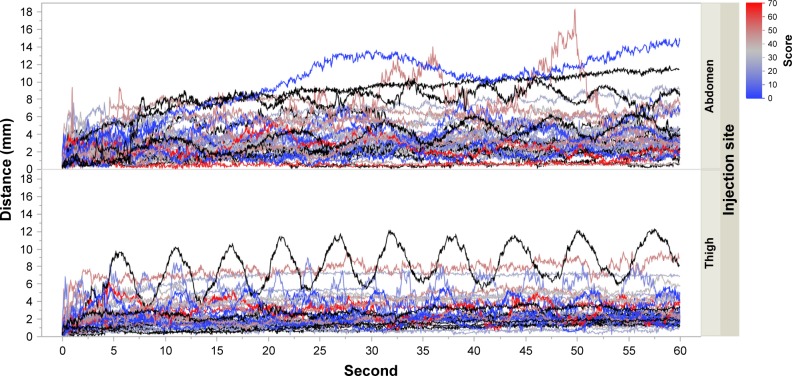
Figure 10.
Needle displacement at every 1/60 second for each subject, split by injection site.
Notes: Black curves represent healthy subjects, and colored curves represent RA subjects. The color scale (blue to red) indicates the severity of the disease (low to high).
Abbreviation: RA, rheumatoid arthritics.

