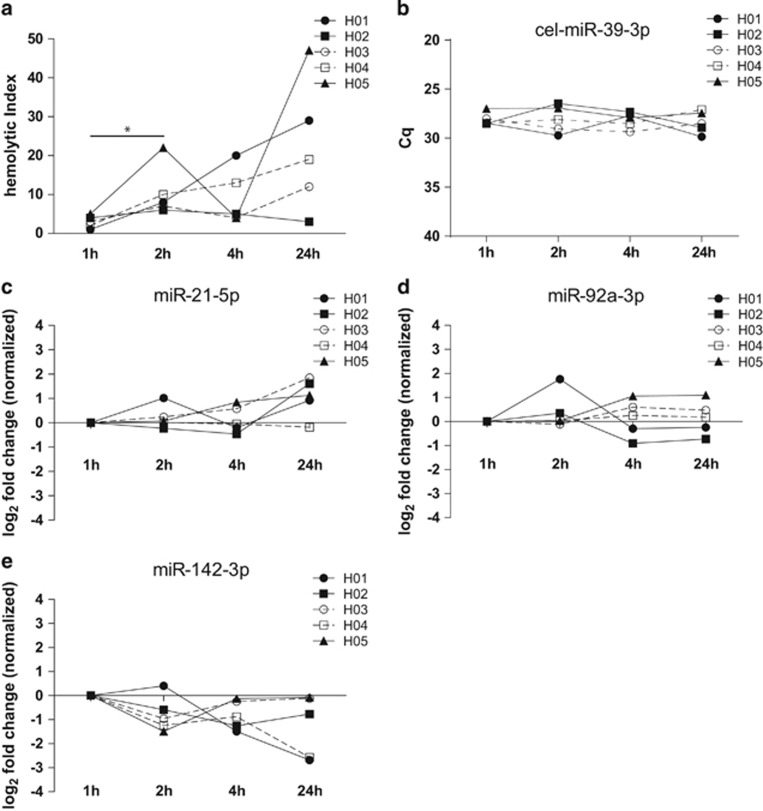
Figure 2.
Hemolysis and ci-miRNA levels according to the serum pre-processing time. Hemolytic index (HI) measured with Roche Modular clinical chemistry platform (a). Cq levels of cel-miR-39-3p (b). miR-21-5p, miR-92a-3p and miR-142-3p levels normalized to the average of miR-16-5p and cel-miR-39-3p and presented as fold change (FCs) compared to 1 h samples (c–e).

