Figure 1.
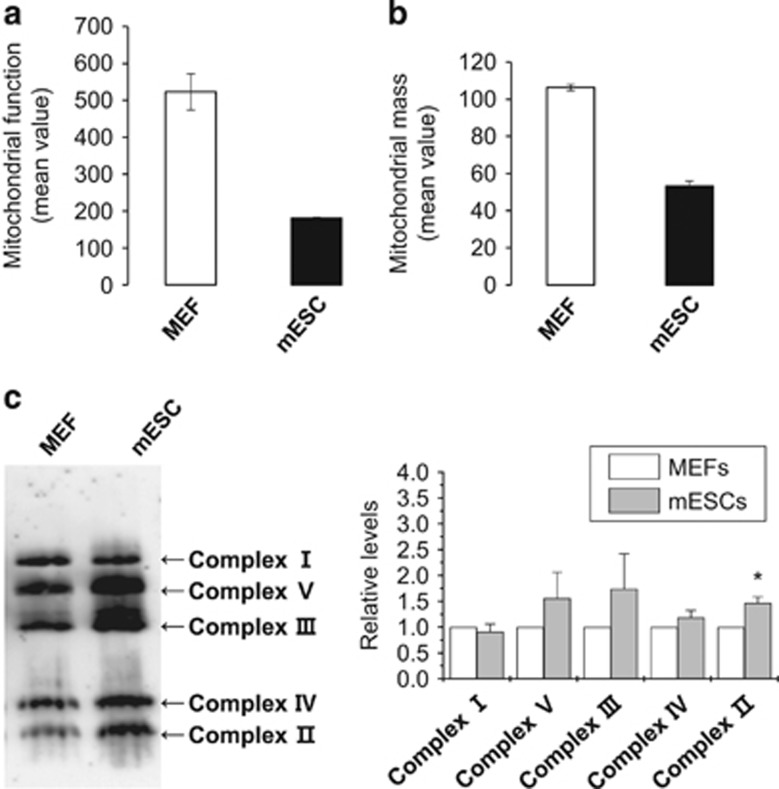
Comparison of mitochondrial function and respiratory complex levels between MEFs and mESCs. Mitochondrial function (a) and mass (b) in MEFs and mESCs. MEFs and mESCs were incubated with 2 μM 5,5′,6,6′-tetrachloro-1,1′3,3′-tetraethyl-benzamidazol carboncyanine (JC-1) (a) or 10 μM 10-nonyl bromide (NAO) (b) for 30 min. JC-1 and NAO fluorescence were measured by flow cytometry at 480 and 550 nm, respectively. Data represent mean fluorescence±s.d. (c) Separation of the mitochondrial respiratory complexes of MEFs and mESCs by blue-native gel electrophoresis. The positions of the complexes are indicated by Roman numerals on the right. The expression levels of the complexes were quantified based on the gel blot image by Fusion Fx7 and Fusion-Capt Advance software (Peqlab). The graph shows relative expression levels of the mitochondrial complexes between MEFs and mESCs. *P<0.01.

