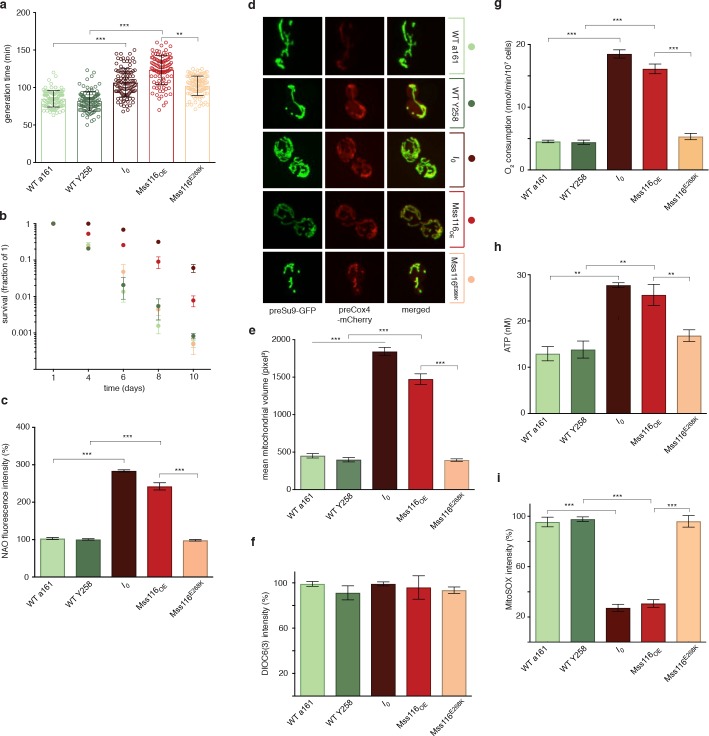
Figure 1. Phenotypic effects of deleting all self-splicing introns from the S. cerevisiae mitochondrial genome.
Deletion of mitochondrial introns (I0) or overexpression of Mss116 (Mss116OE) (a) reduces growth rates, (b) extends chronological lifespan, (c) increases mitochondrial mass, measured as NAO fluorescence, (d,e) increases mitochondrial volume, (g) oxygen consumption, and (h) ATP levels but (i) decreases superoxide levels, measured as MitoSOX fluorescence. (f) Mitochondrial inner membrane potential does not differ significantly between strains. WT a161 and WT Y258 are control strains for I0 and Mss116OE, respectively, as described in the text. The Mss116E268K strain harbours a mutant version of Mss116 that lacks ATPase activity. As a visual guide, strains are colored consistently throughout. Bar heights display the mean of three biological replicates, each calculated as the mean of three technical replicates. Error bars are standard errors of the mean. ***p<0.001; **p<0.01; *p<0.05 (ANOVA plus post hoc).
Figure 1—figure supplement 1. Competitive fitness is decreased in I0 (competed against WT a161) and Mss116OE (competed against the empty vector control WT Y258).
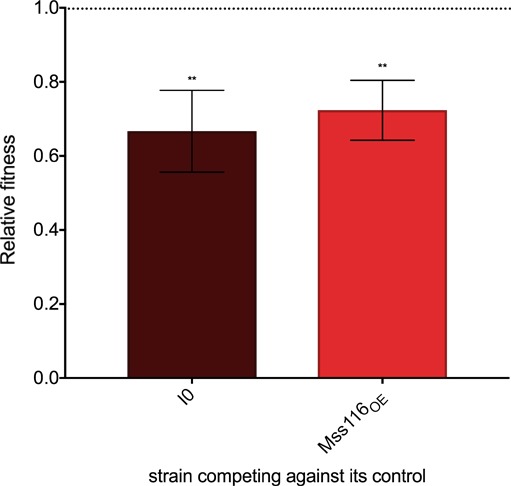
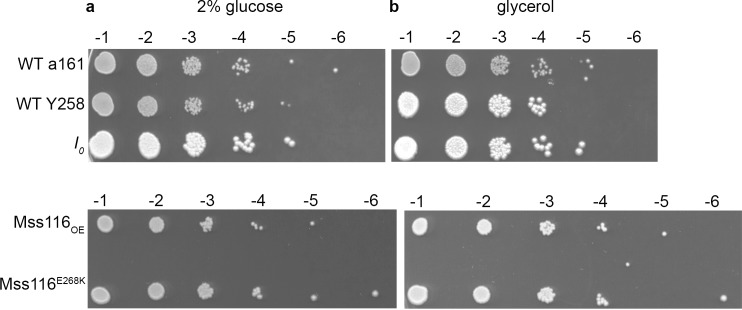
Figure 1—figure supplement 2. I0 and Mss116OE show no qualitative difference in growth on (a) glucose and (b) glycerol.
Figure 1—figure supplement 3. Mss116 expression level is 2.5-fold increased in the Mss116OE strain.
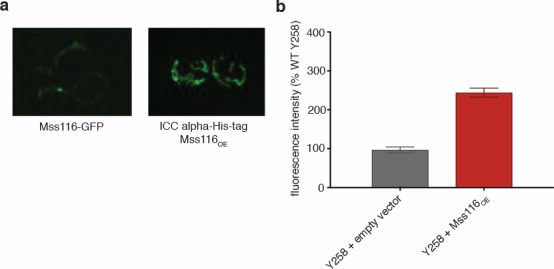
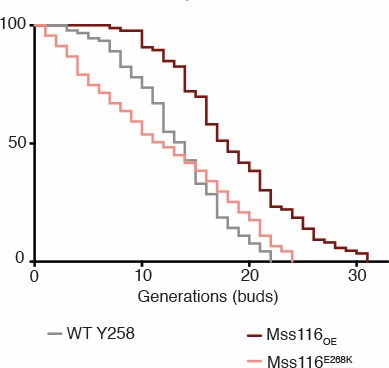
Figure 1—figure supplement 4. Median and maximum replicative lifespan of Mss116OE is extended compared to the empty vector control and Mss116E268K.
