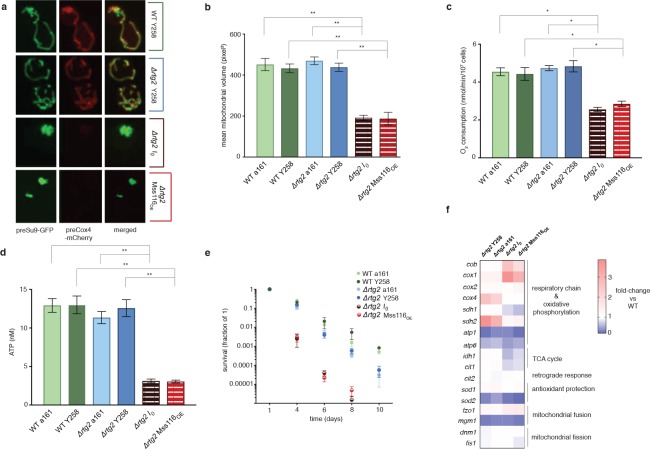
Figure 3. The intronless phenotype requires a functional retrograde response.
(a) Mitochondrial morphology is altered and (b) mitochondrial volume, (c) oxygen consumption, (d) ATP levels, and (e) chronological lifespan are reduced when rtg2 is deleted in the I0 or Mss116OE background. This contrasts sharply with I0 and Mss116OE where rtg2 is intact (see Figure 1). Bar heights display the mean of three biological replicates (each averaged over three technical replicates). Error bars are standard error of the mean. ***p<0.001; **p<0.01; *p<0.05 (ANOVA plus post hoc). (f) Transcriptional responses in different strains where rtg2 has been deleted, as measured by qPCR. Heat maps display mean values of log-fold changes observed across three biological replicates (each averaged over three technical replicates). UBC6 was used for normalization.

