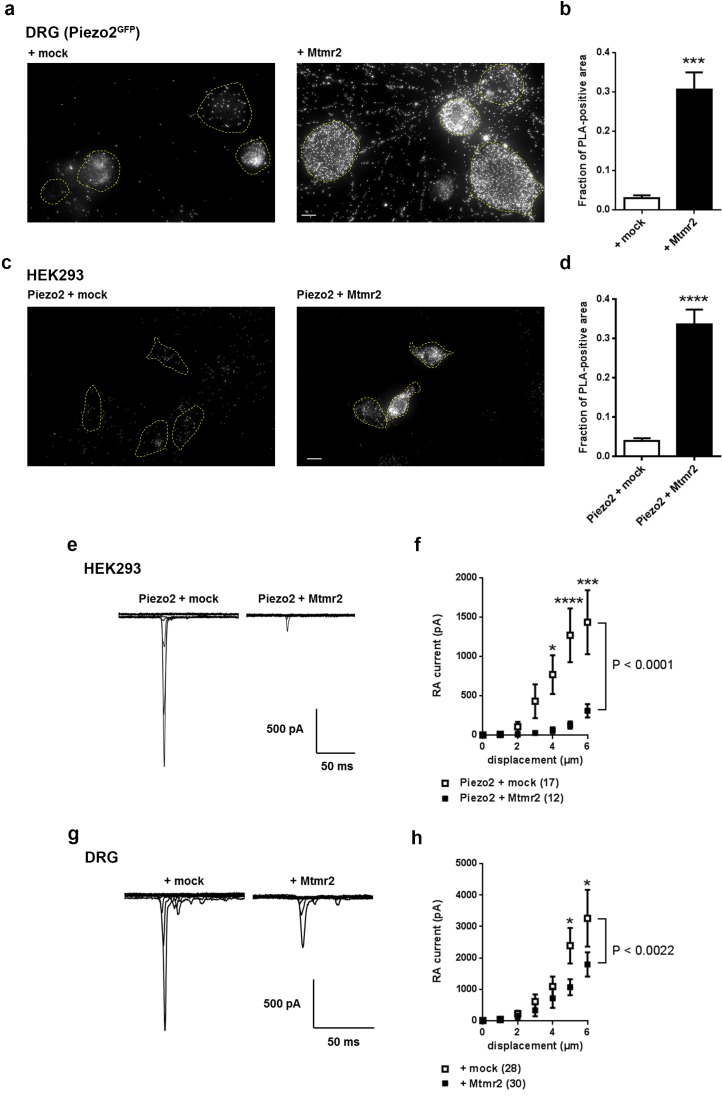
Figure 1. Mtmr2 suppresses Piezo2-mediated RA-MA currents in HEK293 cells and DRG neurons.
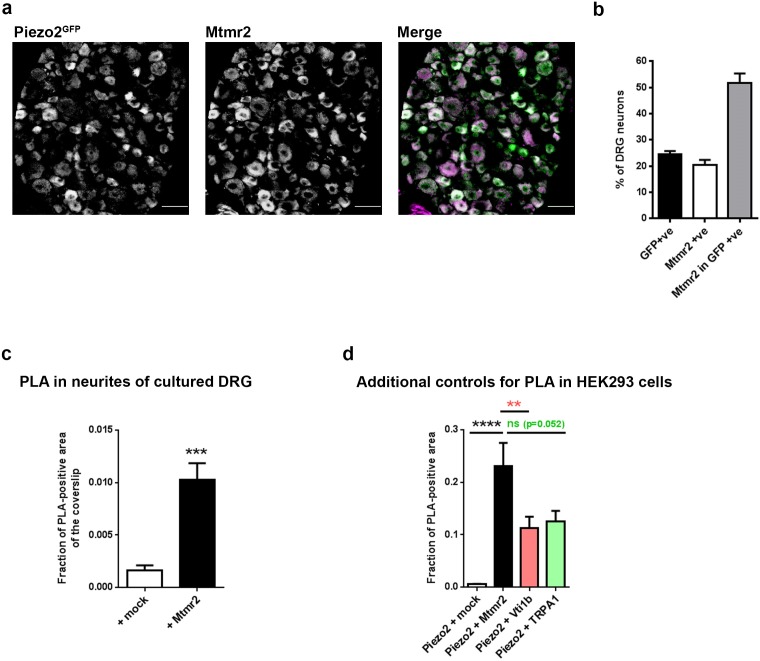
(a–d) Representative images (a,c) and quantification (b,d) of a proximity ligation assay (PLA) in cultured DRG neurons (a,b) of Piezo2GFP mice (Woo et al., 2014) and HEK293 cells (c,d). As anti-Mtmr2 antibodies failed to work in neuronal cultures, DRG were transfected with Mtmr2-myc or mock-myc and PLA was performed with antibodies against Piezo2 and myc. Please note the distribution of the PLA signal in soma and neurites of DRG. HEK293 cells were co-transfected with Piezo2-GST-IRES-GFP and Mtmr2-myc or Piezo2-GST-IRES-GFP and mock-myc and PLA was performed with antibodies against GST and myc. Only cells with pronounced GFP signal (due to expression of pmaxGFPVector in DRG and Piezo2-GST-IRES-GFP in HEK293 cells) were considered for the analysis. Cell boundaries are demarcated in yellow. In both cell types, DRG and HEK293 cells, transfection of Mtmr2-myc exhibited significantly stronger PLA signal compared to controls (b,d). Scale bar: 10 µm. Quantification of the total area of PLA signal/total soma area (fraction of PLA-positive area) in DRG cultures (p<0.0001; Mann-Whitney test; + mock: n = 53 neurons; + Mtmr2-myc: n = 53 neurons) (b). The quantification of the intensity of PLA signal in neurites of cultured DRG neurons can be found in Figure 1—figure supplement 1c. Quantification of the total area of PLA signal/total cell area in HEK293 cells (fraction of PLA-positive area) (p<0.0001; Mann-Whitney test; Piezo2-GST + mock: n = 60 cells; Piezo2-GST + Mtmr2-myc: n = 54 cells) (d). Additional controls for PLA in HEK293 cells can be found in Figure 1—figure supplement 1d. (e) Representative traces of RA-MA currents in HEK293 cells upon co-expression of Piezo2 with mock or Mtmr2 and (f) stimulus-current curves. Overexpression of Mtmr2 suppressed Piezo2 current magnitudes compared to mock overexpression (Piezo2 + mock: n = 17 cells; Piezo2 + Mtmr2: n = 12 cells; 2-way ANOVA suggested a significant effect (P<0.0001) of Mtmr2 overexpression on Piezo2 currents; Holm-Sidak’s multiple comparisons test was used to compare both conditions at individual stimulus magnitudes, p-values are indicated by * in the graph). The displacement threshold was increased upon co-expression of Mtmr2 (p=0.0098; Mann-Whitney test; Supplementary file 1). The inactivation time constant of RA-MA currents remained unchanged (Supplementary file 1). (g) Representative traces of RA-MA currents in primary cultures of DRG neurons and (h) stimulus-current curves showed a significant decrease in RA-MA current magnitude upon overexpression of Mtmr2 compared to mock ( + mock: n = 28 neurons; + Mtmr2: n = 30 neurons; 2-way ANOVA suggested a significant effect (P<0.0022) of Mtmr2 overexpression on RA-MA currents; Holm-Sidak’s multiple comparison test was performed to compare both conditions at individual stimulus magnitudes, p-values are indicated by * in the graph). The displacement threshold and inactivation time constant of RA-MA currents were not changed upon overexpression of Mtmr2 in DRG neurons (Supplementary file 1).


