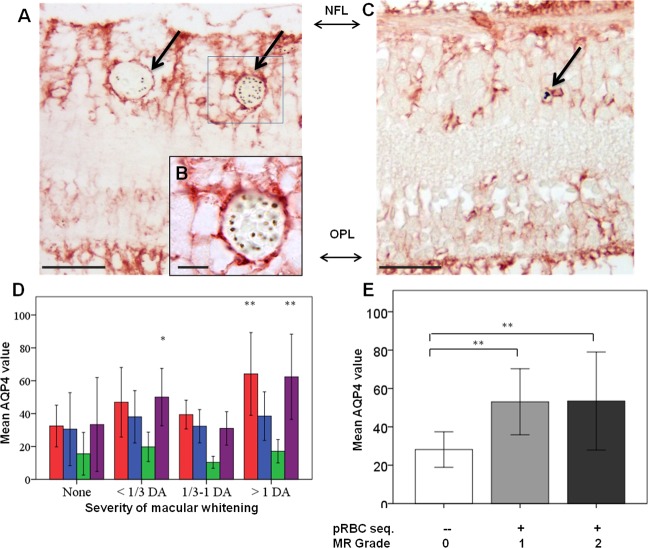
Figure 7. Clinicopathological association between retinal whitening in the macula and increased AQP4 expression in malarial retinopathy.
(A–C) Immunostaining pattern in the macula with (A-B, case no 13) and without whitening (C, case no 21). Parasitised vessels are marked by arrows. The vertical linear pattern indicates Műller cell immunoreactivity for AQP4. (D) Cluster column chart showing densitometrically assessed intensity of immunoreactivity (‘value’) of AQP4 levels measured by IHC in the macula by retinal layers: nerve fibre layer = NFL (red), ganglion cell layer = GCL (blue), inner plexiform layer = IPL (green), outer plexiform layer = OPL (purple). (E): AQP4 levels in the nerve fibre layer plotted against MR severity classification groups (grade 0 = none, 1 = mild, two moderate/severe). Means ± SD are reported in all graphs; ANOVA was used to compare means (N = 26). *p<0.05 and **p<0.001. Scale bars: 50 μm (panels C, E, F and G); 10 μm (panel D).


