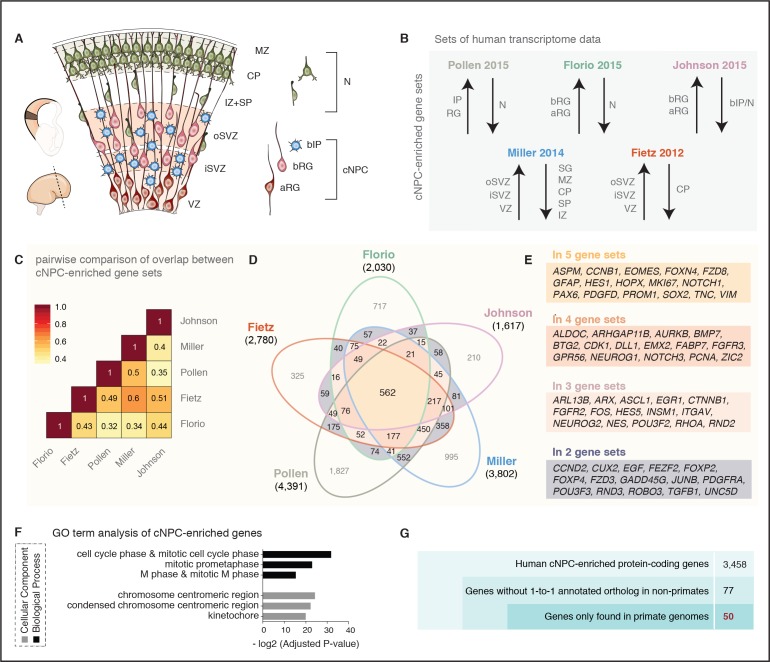
Figure 1. A screen for human cNPC-enriched protein-coding genes and determination which of them have orthologs only in primates.
(A) Cartoon illustrating the main zones and neural cell types in the fetal human cortical wall that were screened for differential gene expression in the human transcriptome datasets as depicted in (B). Adapted from (Florio et al., 2017). SP, subplate; MZ, marginal zone. (B) The indicated five published transcriptome datasets from fetal human neocortical tissue (Fietz et al., 2012; Miller et al., 2014) and cell populations (Florio et al., 2015; Johnson et al., 2015; Pollen et al., 2015), were screened for protein-coding genes showing higher levels of mRNA expression in the indicated germinal zones and cNPC types than in the non-proliferative zones and neurons. (C) Heat map showing a pairwise comparison of the degree of overlap between the five gene sets of human genes with preferential expression in cNPCs. (D) Venn diagram showing the gene sets of human protein-coding genes displaying the differential gene expression pattern depicted in (B). Numbers within the diagram indicate genes found in two (violet), three (pink), four (orange) or all five (yellow) gene sets. Genes found in at least two gene sets were considered as being cNPC-enriched. (E) Selected genes with established biological roles found in two, three, four, or all five gene sets. (F) GO term analysis of human cNPC-enriched genes. The top three most enriched terms for the category Cellular Component (black bars) and for the category Biological Process (grey bars) are shown. (G) Stepwise analysis leading from the 3458 human cNPC-enriched protein-coding genes to the identification of 50 primate-specific genes.


