. 2018 Mar 21;7:e32332. doi: 10.7554/eLife.32332

Figure 7. Comparison of the mRNA expression of 12 human-specific cNPC-enriched protein-coding genes with their ancestral paralogs in isolated cell populations enriched in aRG, bRG and neurons from fetal human neocortex.

A previously published genome-wide transcriptome dataset obtained by RNA-Seq of cell populations isolated from fetal human neocortex, that is, aRG (orange) and bRG (yellow) in S-G2-M and a fraction enriched in neurons but also containing bRG in G1 (N, purple) (Florio et al., 2015), was analyzed for the abundance of mRNA-Seq reads assigned to either the indicated human-specific gene(s) under study (blue background) or the corresponding ancestral paralog (white background), using the Kallisto algorithm. (A) Min-max box-and-whiskers plots showing mRNA levels (expressed in Transcripts Per Million, TPM); red lines indicate the median. (B) Stacked bar plots showing the cumulative mRNA expression levels in the indicated cell types (sum of the median TPM values shown in (A)).

Figure 7—source data 1. Alignments of the mRNA sequences of ancestral and human-specific paralogs of the orthology groups ANKRD20A, ARHGAP11, CBWD, DHRS4, FAM72, GTF2H2, NOTCH2 and ZNF98.
This zipped folder contains 8 files of alignments between the mRNA sequences of ancestral and human-specific paralogs of the orthology groups ANKRD20A, ARHGAP11, CBWD, DHRS4, FAM72, GTF2H2, NOTCH2 and ZNF98 that were used as a mapping reference to identify paralog-specific mRNA reads in the analysis performed in Figure 7—figure supplement 2.
DOI: 10.7554/eLife.32332.021

Figure 7.

Figure 7—figure supplement 1. qPCR validation of the Kallisto analysis.

Figure 7—figure supplement 1.

Previously prepared cDNAs of radial glial cell populations (aRG, orange; bRG, yellow) in S-G2-M and of a fraction enriched in neurons but also containing bRG in G1 (N, purple) isolated from fetal human neocortex (Florio et al., 2015) were re-analyzed by qPCR in order to quantify the expression of the human-specific cNPC-enriched genes ARHGAP11B, GTF2H2C, NOTCH2NL, and ZNF492 (blue background) compared to their respective ancestral paralogs ARHGAP11A, GTF2H2, NOTCH2, and ZNF98 (white background). The resulting value for the mRNA level of a given gene is expressed relative to that of GAPDH in the indicated cell type. Error bars indicate the SD of technical replicates (3 PCR amplifications).
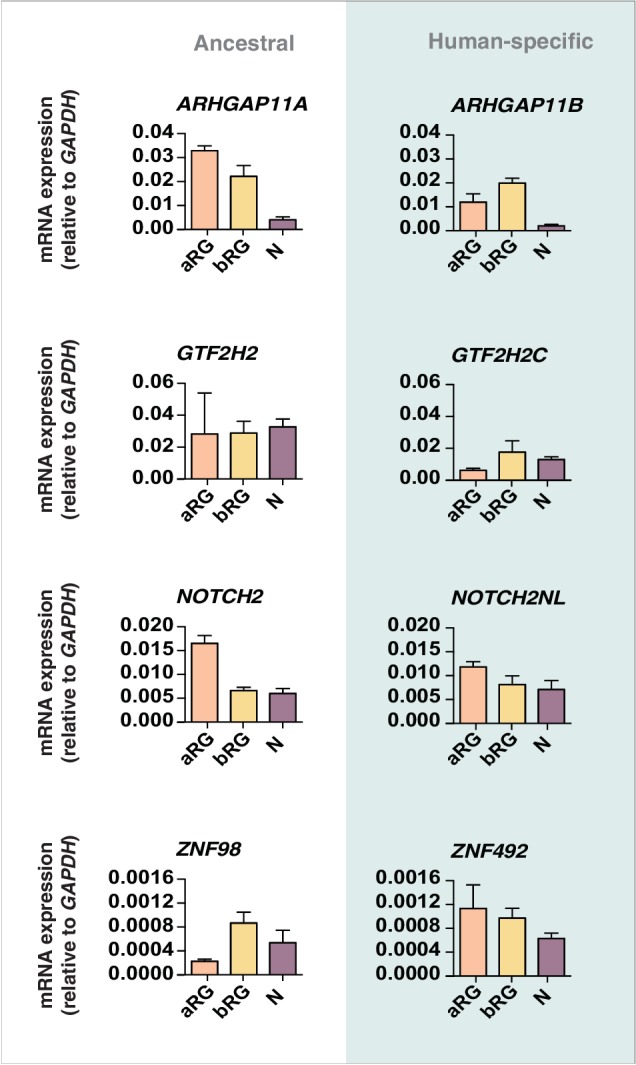
Figure 7—figure supplement 2. Comparison of the paralog-specific mRNA expression between 11 human-specific cNPC-enriched genes and their respective ancestral paralog in aRG, bRG and neuron-enriched cell populations from fetal human neocortex.

Figure 7—figure supplement 2.

(A) Diagram outlining the strategy used to ascertain paralog-specific mRNA expression in a given cell type of interest. mRNA sequences of an ancestral vs. a human-specific paralog (paralog A vs. B in the example shown) were aligned, and the homologous, yet distinct, core sequences of each alignment were extracted. The corresponding sequences of each paralog were used as a mapping reference for RNA-Seq reads from aRG, bRG and neuron-enriched cell populations from fetal human neocortex (Florio et al., 2015). Only reads aligning to ‘unique mappers’, i.e. paralog-specific sites (SNPs or indels), were used for the analysis shown in (B). In the example shown, paralog-specific reads specific for paralog A or paralog B, as defined by the paralog-specific base (vertical yellow line) are colored in purple and orange, respectively. (B) Bar plots showing the total numbers of paralog-specific RNA-Seq reads (identified as described in (A)) found in aRG vs. bRG vs. neuron-enriched (N) cell populations from fetal human neocortex (Florio et al., 2015). Grey bars indicate human-specific genes; black bars indicate their respective ancestral paralog. Data are the mean of four individual samples isolated from two human specimens; errors bars, SD.
Figure 7—figure supplement 3. mRNA expression levels of the 15 human-specific, cNPC-enriched, protein-coding genes in the human individuals analyzed in the Fietz et al., Florio et al. and Johnson et al. transcriptome datasets.

Figure 7—figure supplement 3.

Horizontal bars indicate the FPKM values for the mRNA levels of the 15 genes (top) in the indicated germinal zones (Fietz) and cell populations (Florio, Johnson) (left to each plot) in each of the individual human specimen analyzed in Fietz (six specimen), Florio (two specimen) and Johnson (three specimen). Individual specimen are color-coded as indicated in the key on the right, which also gives the gestational age of the specimen (wpc). Average mRNA levels are depicted on top of each plot (grey bars). Error bars indicate SD. Average mRNA levels with blue background indicate genes that are cNPC-enriched in the respective gene set.
Figure 7—figure supplement 4. Analysis of the expression of the 15 human-specific, cNPC-enriched, protein-coding genes in the cell types of the Pollen et al. transcriptome dataset and in the cortical zones of the Miller et al. transcriptome dataset.

Figure 7—figure supplement 4.

(A, B) Pollen et al. transcriptome dataset. (A) Plot showing the scores of correlation with radial glia (RG, X axis) vs. neuron (Y axis) regarding the expression of each of the 15 genes. Red dots indicate genes the expression of which is cNPC-enriched, grey dots genes the expression of which is not. Yellow box indicates the coordinates corresponding to the selection filter used to define cNPC-enriched expression in the Pollen et al. dataset. (B) Plot showing the scores of correlation with aRG (X axis) vs. bRG (Y axis) regarding the expression of each of the 12 human-specific genes, classified as cNPC-enriched in the Pollen et al. dataset (red dots in A). Note that all these 12 genes positively correlate with both aRG and bRG. (C) Heat map showing the laminar correlation scores (see color key on right) with the various cortical zones analyzed in the Miller et al. transcriptome dataset regarding the expression of each of the 15 genes. Red letters indicates genes that are cNPC-enriched in the Miller et al. dataset, black letters indicate genes that are not. Grey letters indicate genes that were not detected in the Miller et al. dataset.