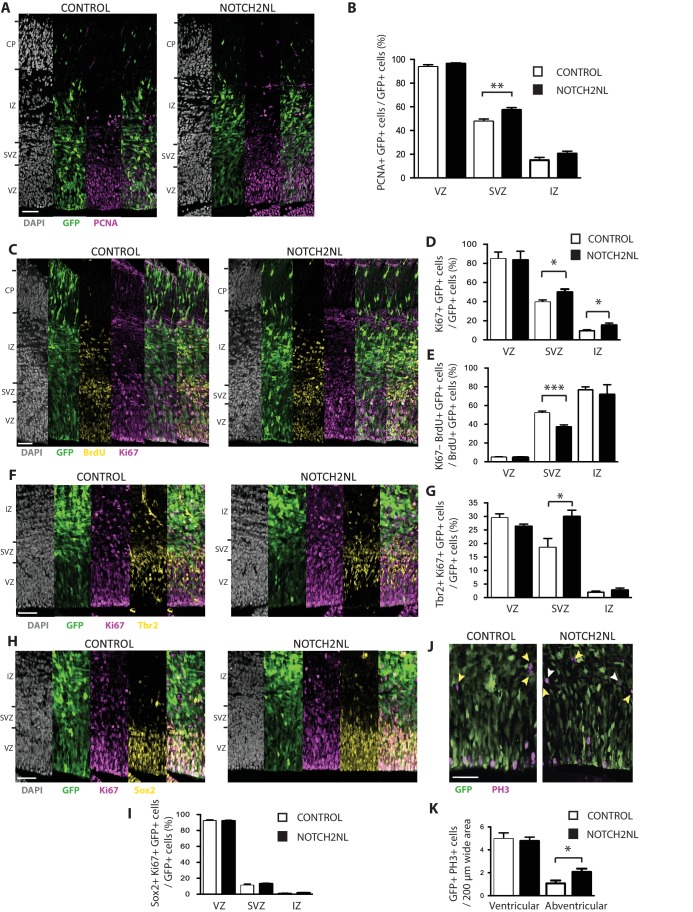
Figure 9. Forced expression of NOTCH2NL in mouse embryonic neocortex increases cycling basal progenitors.
The neocortex of E13.5 mouse embryos was in utero co-electroporated with a plasmid encoding GFP together with either an empty vector (Control) or a NOTCH2NL expression plasmid (NOTCH2NL), all under constitutive promoters, followed by analysis 48 hr later. Bromodeoxyuridine (BrdU) was administered by intraperitoneal injection (10 mg/kg) into pregnant mice at E14.5 (C, E). (A) GFP (green) and PCNA (magenta) double immunofluorescence combined with DAPI staining (white) of control (left) and NOTCH2NL-electroporated (right) neocortex. (B) Quantification of the percentage of the progeny of the targeted cells, that is, the GFP+ cells, that are PCNA+ in the VZ, SVZ and IZ upon control (white columns) and NOTCH2NL (black columns) electroporation. (C) GFP (green), BrdU (yellow), and Ki67 (magenta) triple immunofluorescence combined with DAPI staining (white) of control (left) and NOTCH2NL-electroporated (right) neocortex. (D) Quantification of the percentage of the progeny of the targeted cells, that is, the GFP+ cells, that are Ki67+ in the VZ, SVZ, and IZ upon control (white columns) and NOTCH2NL (black columns) electroporation. (E) Quantification of the percentage of the BrdU-labeled progeny of the targeted cells, that is, the GFP+ cells, that are Ki67–, that is, that did not re-enter the cell cycle, in the VZ, SVZ, and IZ upon control (white columns) and NOTCH2NL (black columns) electroporation. (F, H) GFP (green), Ki67 (magenta), and either Tbr2 (F) or Sox2 (H) (yellow) triple immunofluorescence combined with DAPI staining (white) of control (left) and NOTCH2NL-electroporated (right) neocortex. (G, I) Quantification of the percentage of the progeny of the targeted cells, that is, the GFP+ cells, that are Ki67+ and Tbr2+ (G) or Ki67+ and Sox2+ (I) in the VZ, SVZ and IZ upon control (white columns) and NOTCH2NL (black columns) electroporation. (J) GFP (green) and phosphohistone H3 (PH3, magenta) double immunofluorescence of control (left) and NOTCH2NL-electroporated (right) neocortex. Yellow arrowheads, GFP– and PH3+ abventricular cells. White arrowheads, GFP+ and PH3+ abventricular cells. (K) Quantification of the number of ventricular and abventricular progeny of the targeted cells, that is, the GFP+ cells, that are in mitosis (PH3+) in a 200 μm-wide microscopic field upon control (white columns) and NOTCH2NL (black columns) electroporation. (A, C, F, H, J) Images are single 2 μm optical sections. Scale bars, 50 μm. (B, D, E, G, I, K) Data are mean of 6–11 embryos each, averaging the numbers obtained from 1 to 4 cryosections per embryo (one 100 μm-wide (B, D, E, G, I) or 200 μm-wide (K) microscopic field per cryosection). Error bars indicate SEM; *p<0.05; **p<0.01;***p<0.001; Student’s t-test.

