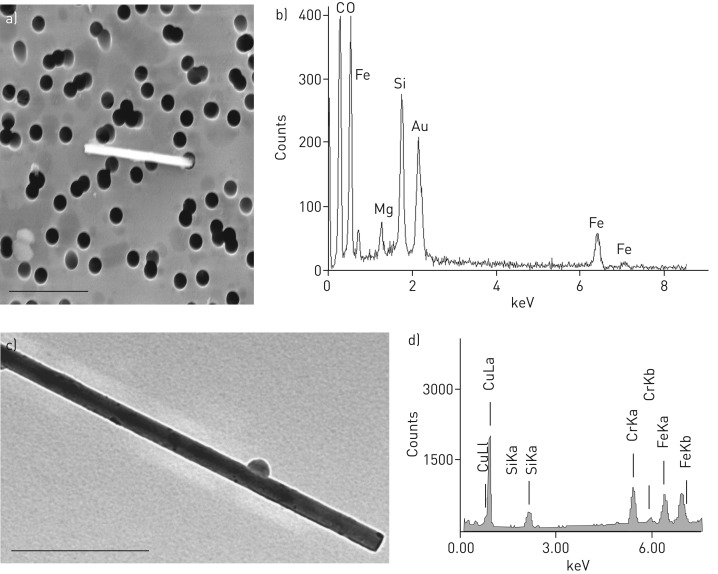
FIGURE 4.
Amphibole-fibre with the corresponding spectra obtained by energy-dispersive X-ray (EDX) analysis. a) Field emission scanning electron microscopic image from an edged fibre extracted from lung tissue of an asbestos exposed patient. The fibre is greater than 5 µm and thinner than 3 µm. 10 000-fold magnification. b) The EDX spectra of the fibre with magnesium (Mg), silicon (Si) and iron (Fe). The elemental composition and morphology of the fibre is typical for amphibole. The gold (Au) signal originates from the filter and should be ignored. c) Transmission electron microscopy image of an amphibole fibre with residual macrophage body and the corresponding EDX spectra (d). The copper (Cu) signal originates from the grid and should be ignored.

