
FIGURE 1.
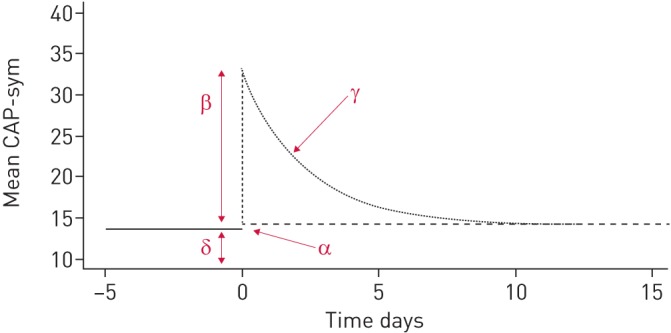
Schematic representation of a pneumonia symptom profile; δ represents the pre-pneumonia level, β is the peak symptom level, γ is the symptom decay after admission and α is the residual symptom score after follow-up.
Official websites use .gov
A
.gov website belongs to an official
government organization in the United States.
Secure .gov websites use HTTPS
A lock (
) or https:// means you've safely
connected to the .gov website. Share sensitive
information only on official, secure websites.
Schematic representation of a pneumonia symptom profile; δ represents the pre-pneumonia level, β is the peak symptom level, γ is the symptom decay after admission and α is the residual symptom score after follow-up.