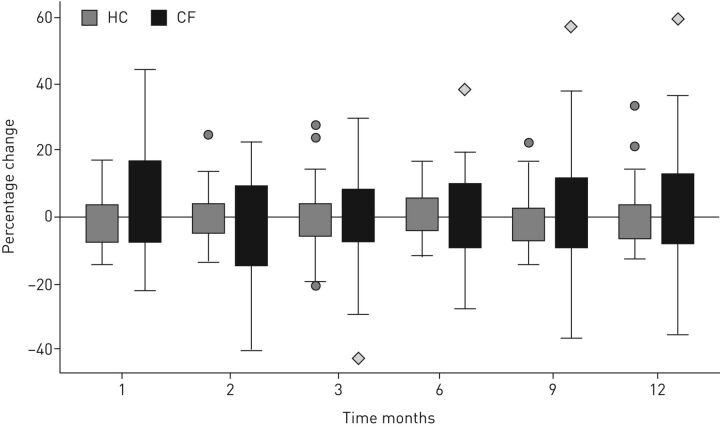
FIGURE 4.
Percentage changes between LCI measurements were independent of the time interval between measurements in both health and in stable cystic fibrosis disease. Boxplots indicate the median value (centre line); inter-quartile range (box) and minimum and maximum values, excluding outliers greater than three-times the lower quartile (error bars).

