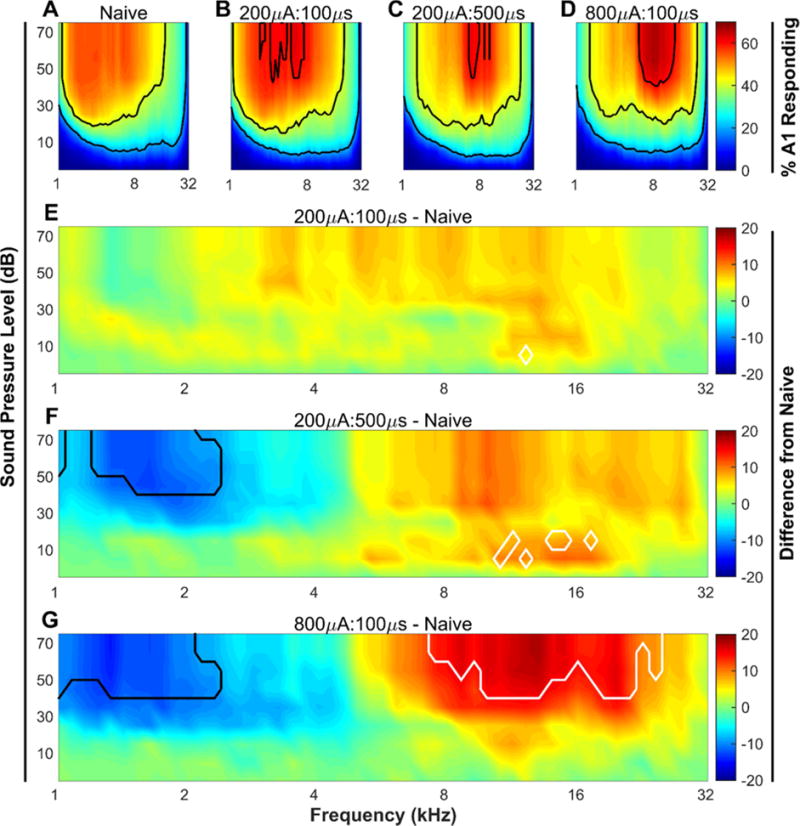
Figure 2. VNS-tone pairing drives plasticity in auditory cortex.

(A – D) Percent of the area of primary auditory cortex responding to each of the 1296 tones played. Black contour lines indicate 20, 40, and 60% of primary auditory cortex responding. (E – G) The group average difference in the percent of cortex responding to each tone between each of the three experimental groups and the naïve group. White contour lines surround tones that were significantly (P < 0.05) increased between the two groups, while black contour lines surround tones that were significantly (P < 0.05) decreased. N = 10, 10, 9, & 7 for Naïve, 200μA:100μs, 200μA:500μs, & 800μA:100μs groups, respectively.
