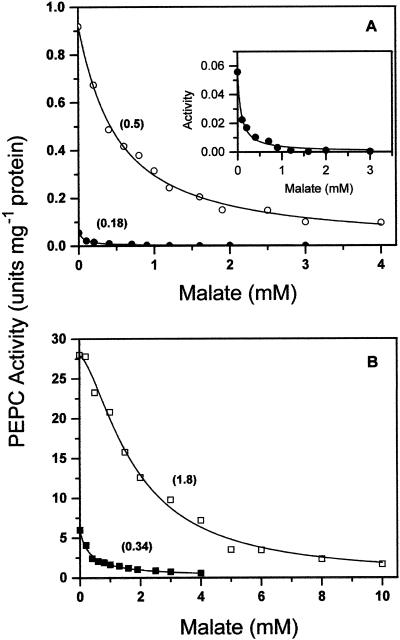
Figure 3.
Kinetics of saturation of nonphosphorylated maize leaf PEPC by malate at 0.4 mm (●, ▪) or 10 mm (○, □) free Mg2+ and 0.1 mm (A) or 3 mm (B) total PEP. The inset shows the saturation by malate at 0.4 mm free Mg2+ and 0.1 mm total PEP in a small scale. The points are the experimental data. The lines are the result of the best fit of the experimental data to Equation 14 or 15 as appropriate. In Table II are given the corresponding concentrations of free PEP and Mg-PEP. Within parentheses are given the I0.5 values estimated for each data set.

