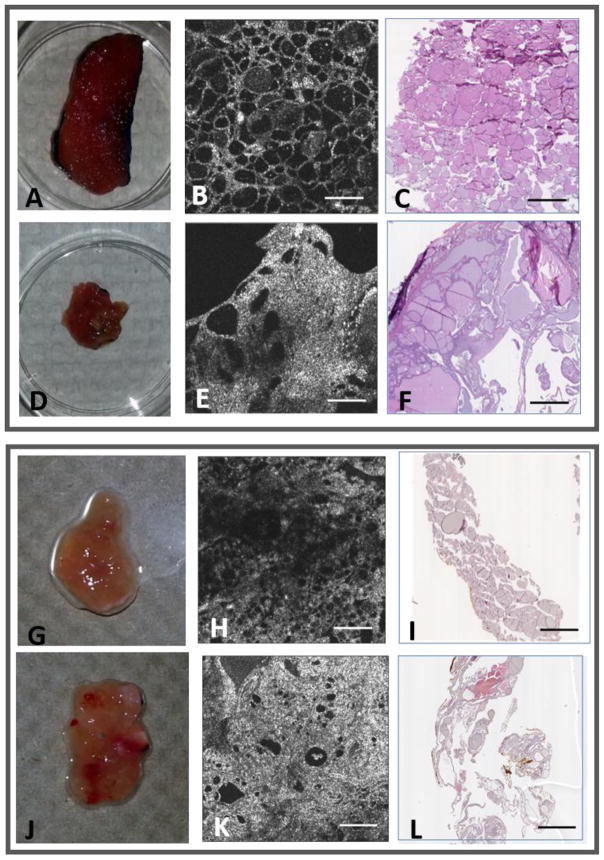
Fig. 4.
OCT and corresponding histology of normal and benign thyroid tissues. Upper Panel: (A, D) Photos and (B, E) OCT images of normal and goiter tissue regions from the same patient, along with (C, F) the corresponding histology images, respectively. Lower Panel: (G, J) Photos and (H, K) OCT images of normal and follicular adenoma tissue regions from the same patient, along with (I, L) the corresponding histology images, respectively. All scale bars: 1 mm.

