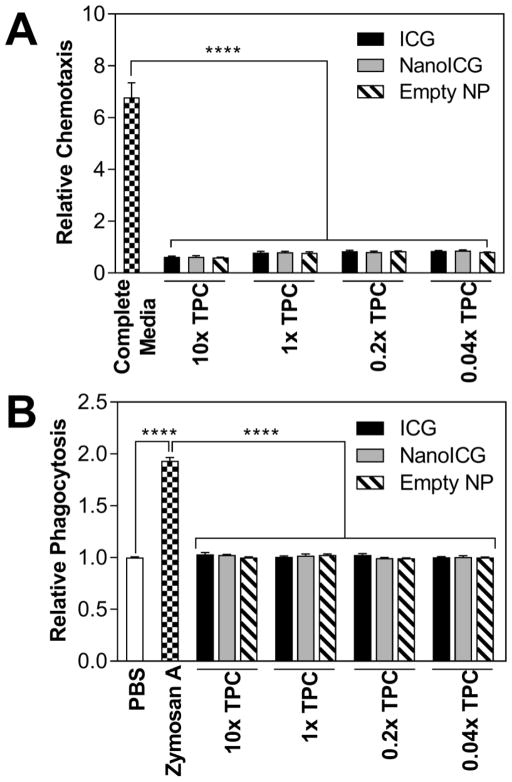
Figure 2.
(A) Chemotaxis assay of HL-60 with ICG, NanoICG and empty NP at varied concentrations based of theoretical plasma concentration (TPC) at 4 h time point. Complete medium is IMDM with 20% FBS. Fluorescent spectra of calcein AM was collected at 485 nm excitation/535 nm emission; (B) Phagocytic assay of NanoICG in HL-60. Zymosan A served as the positive control while PBS was the negative control. Luminesance reading was monitored for 1.5 h with 2.1 min intervals and AUC of fluorescent signal was quantified as chemotactic response. ****p < 0.0001.

