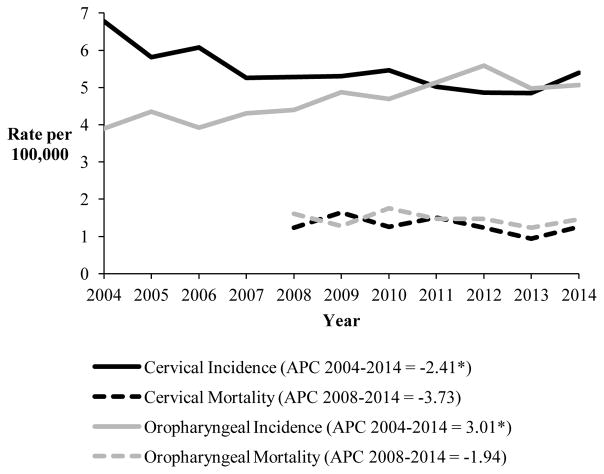
Figure 1.
Trends in cervical and oropharyngeal cancer incidence (2004–2014) and mortality rates (2008–2014) in Massachusetts
Rates are age-adjusted to the 2000 US standard population. The annual percent change (APC) values for the trends in incidence and mortality rates are presented in the legend. Statistically significant trend (p<0.05) in the APC are denoted with an *.

