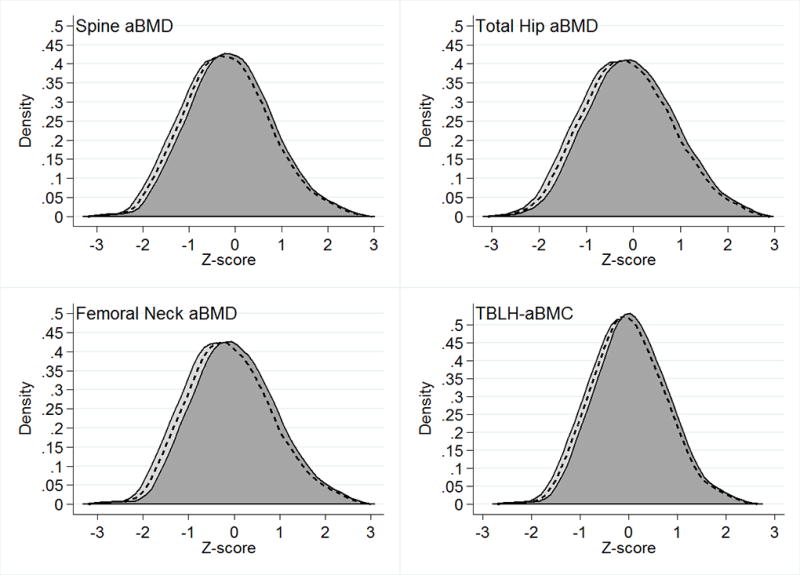
Figure 1.

Bone Z-score frequency distributions by weight bearing physical activity composition. The dashed lines represent bone Z-scores for a population spending 1 hour per day in total physical activity with equal time in high and low impact physical activity. The light gray distributions (shifted to the left) represent bone Z-scores for a population spending 1 hour per day in low impact physical activity and no time in high impact physical activity. The dark gray distributions (shifted to the right) represent bone Z-scores for a population spending no time in low impact physical activity and 1 hour per day in high impact physical activity.
