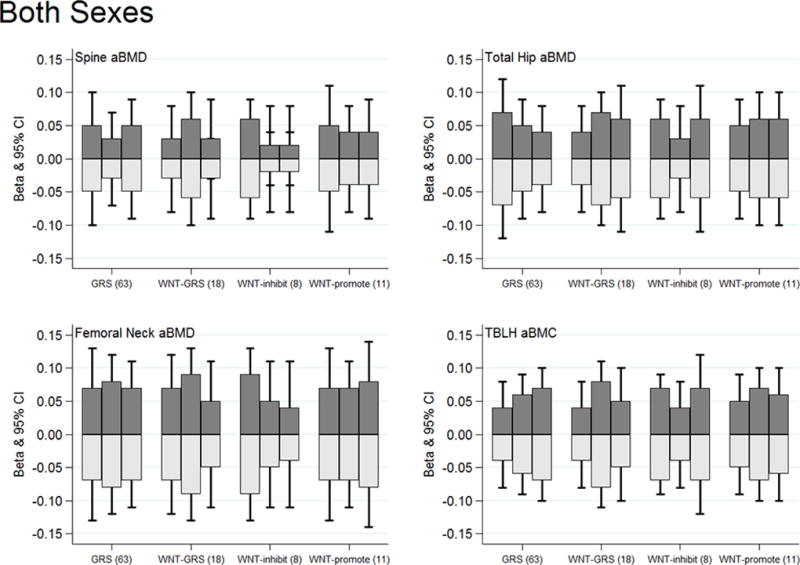
Figure 4.

High and low impact physical activity substitutions associations with bone Z-scores by genetic risk score tertiles for both sexes combined. The dark gray bars illustrate substitution associations for low-for-high impact physical activity. Light gray bars illustrate substitution associations for high-for-low impact physical activity. No statistical evidence of any physical activity substitution by genetic score interactions (P-interactions >0.05). All models adjusted for age, sex, Tanner stage, BMI Z-score, and dietary calcium. The sex-specific graphs can be viewed in Supplementary Figure 4 [see Figure, Supplemental Digital Content 9, High and low impact physical activity substitution by genetic risk score tertiles for (A) males and (B) females].
