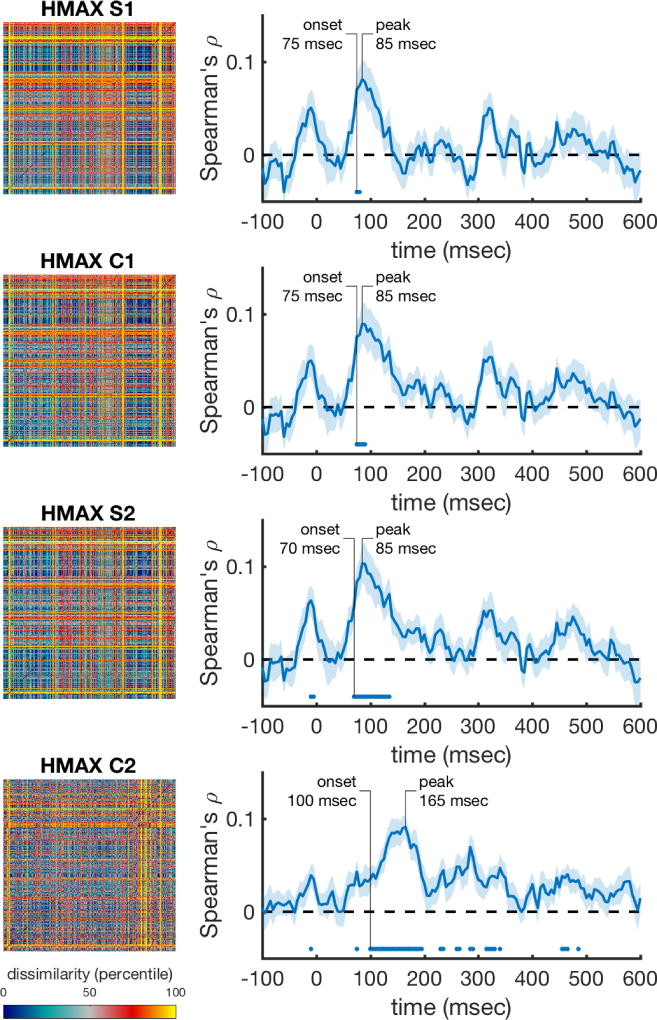
Figure 3. Performance of the low level visual models over time (HMAX layers).
The rank-transformed RDMs are shown on the left, and their respective correlations with the time-varying neural RDMs are shown on the right. Marks above the x-axis show significant above-zero correlations (p<0.05 fdr-corrected). Shaded areas represent standard error over participants. Peak correlation and the onset of a sustained significant correlation are annotated in each trace.

