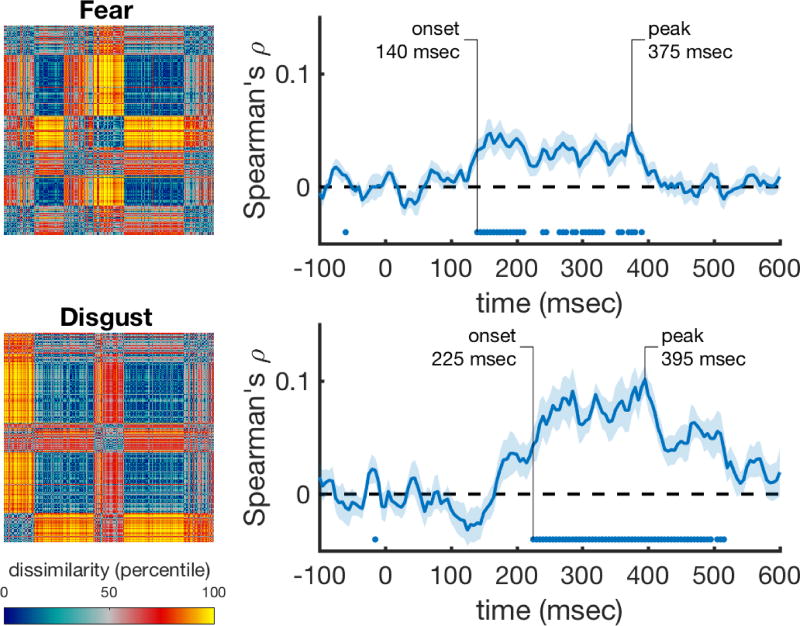
Figure 6. Performance of the fear and disgust rating scale models over time after correcting for HMAX and valence/arousal correlations.
The rank-transformed RDMs are shown on the left, and their respective correlations with the time-varying neural RDMs are shown on the right. Correlations were computed using partial correlations to control for the correlations with the HMAX C2 model, and with the valence and arousal models. Marks above the x-axis show significant above-zero correlations (p<0.05 fdr-corrected). Shaded areas represent standard error over participants. Peak correlation and the onset of a sustained significant correlation are annotated in each trace.

