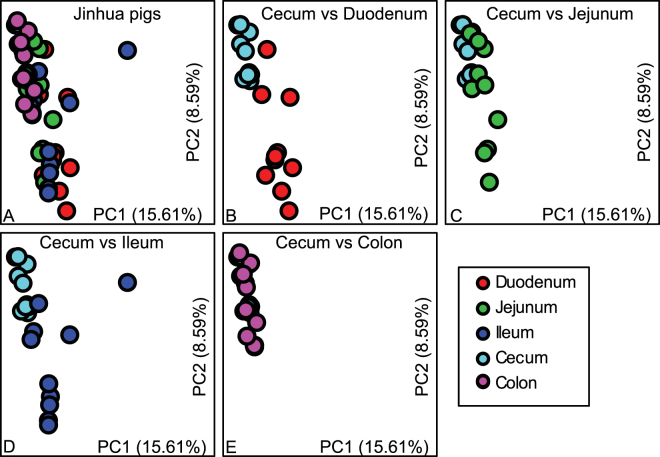
Figure 3.
Biogeography of gut microbiome in Jinhua pigs. Principal coordinate analysis (PCoA) shows bacterial community structures based on Bray-Curtis distances. On the PCoA plot, each symbol represents one gut microbiome. (A) The microbiota composition in five intestinal segments in Jinhua pigs. (B–E) Pair-wise comparison between the cecal microbiota vs the microbiota in the duodenum, jejunum, cecum and colon, respectively. The numbers of PC1 and PC2 shows the percent variation explained by the PCoA plot.

