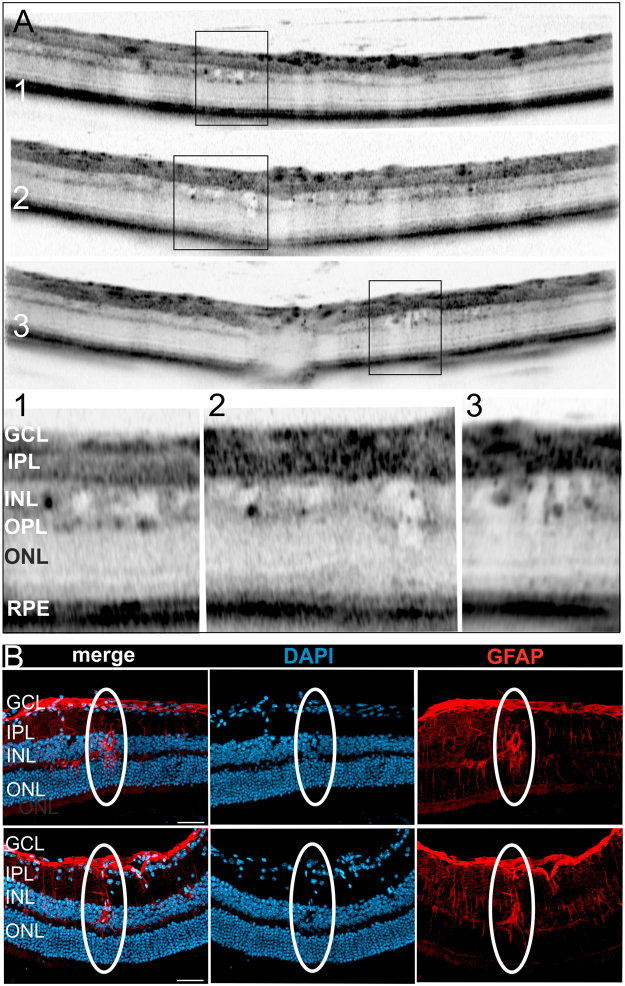
Figure 5.
Detailed analysis of intraretinal microcysts. (A) Representative OCT sections show several intraretinal cysts in two months old mutant animals. The regions of interest are depicted by rectangles with the respective magnifications numbered correspondingly. (B) Histological sections stained with DAPI and GFAP to detect activated Müller glia cells. Overlay of the labelling (merge) clearly revealed the direct correlation of the Müller cell with the intraretinal cyst, two representative cysts are shown. Scale bar, 50 µm.

