Figure 6.
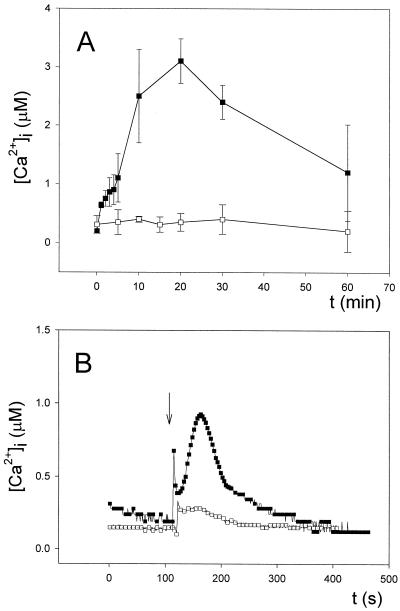
Changes in [Ca2+]i in response to heat shock. A, Continued heat shock treatment (up to 60 min) in a water bath at 44°C of coelenterazine-treated cells (▪). Cuvettes were removed from the water bath at specific times to monitor luminescence as described in “Materials and Methods.” Cells maintained in a water bath at 28°C were taken as the control (□). Measurements were made maintaining an external Ca2+ concentration of 0.25 mm. B, Coelenterazine-treated cells were heat-shocked by injecting hot water at 65°C to achieve a final temperature of 44°C in the cuvette and luminescence recorded as described in “Materials and Methods” (▪). Cells irrigated with water at 28°C were taken as the control (□). Measurements were made maintaining an external Ca2+ concentration of 0.25 mm. Experiments were repeated 15 times and the error bars represent ±se (A). Experiments were repeated 15 times, and the traces represented have been chosen to best represent the average result (B). The vertical arrow in B indicates the injection of hot water.

