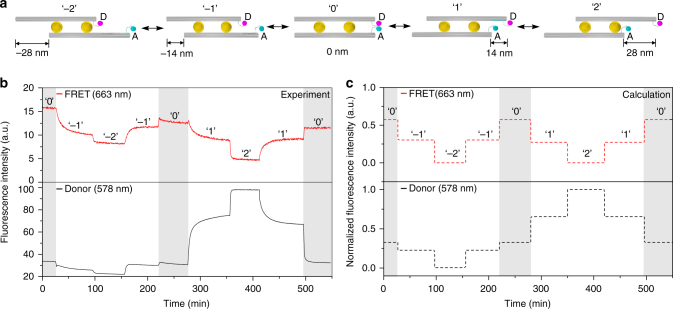
Fig. 3.
AuNC-mediated relative sliding monitored by in situ fluorescence spectroscopy. a Schematic of the five sliding states ‘– 2,’ ‘– 1,’ ‘0,’ ‘1,’ and ‘2.’ D and A represent donor and acceptor, respectively. b Experimental FRET and donor fluorescence signals monitored at wavelengths of 663 nm and 578 nm, respectively, with excitation wavelength of 530 nm. c Theoretical calculation including both FRET between the fluorophores and electromagnetic quenching of the fluorophores by the AuNCs

