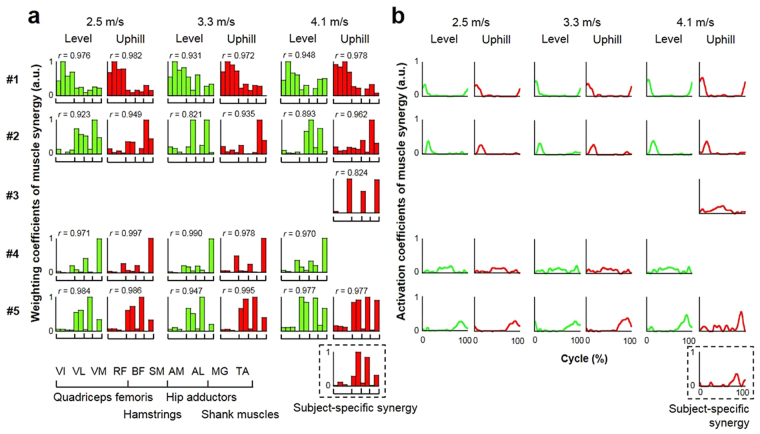
Figure 3.
A typical example of extracted muscle synergy during level and uphill running. (a) Each bar represents the relative spatial information of muscle coactivation within each synergy. Weighting coefficients were normalized by maximum values under the synergy. The r value represents cosine similarities between averaged muscle weighting components across subjects, and is shown just above each bar graph. (b) Each waveform represents the temporal activation pattern of the synergy related to individual muscle weighting components. Synergy surrounded by a dashed line is a subject-specific synergy. #1, Synergy 1; #2, Synergy 2; #3, Synergy 3; #4, Synergy 4; #5, Synergy 5; a.u., arbitrary units.

