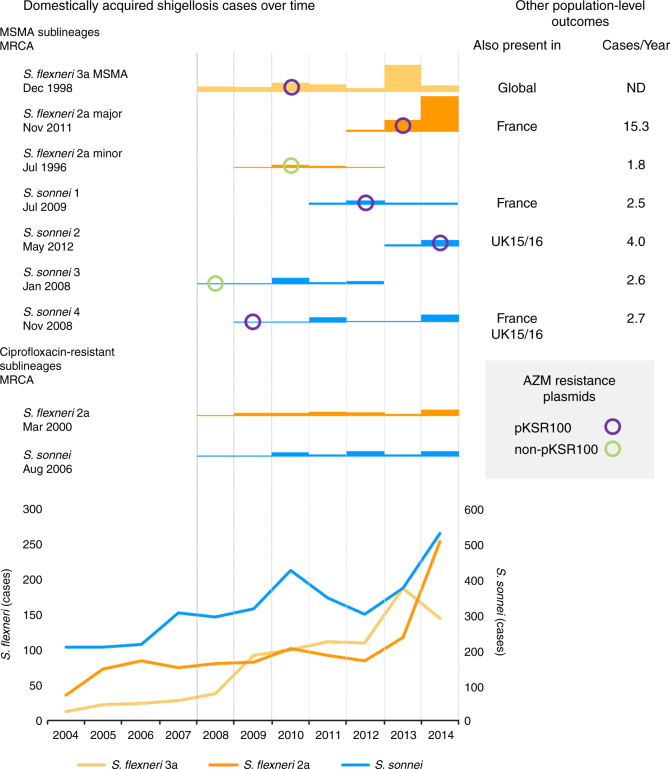
Fig. 2.
MSMA sublineage epidemiology and relationship with azithromycin (AZM) resistance determinants. The total number of domestically acquired shigellosis cases is shown in the below graph. Above, the relative number (owing to differences in sampling approach, S. flexneri 3a is scaled 1:3 relative to the other sublineages, exact numbers available in Supplementary Data 1) of isolates sequenced that belonged to different MSMA and ciprofloxacin-resistant sublineages is shown by year, along with the time to most recent common ancestor (MRCA). These bar charts are overlaid by a marker indicating the year of first observation, and classification, of azithromycin-resistance plasmids in the sublineage, according to the inlaid key. For MSMA sublineages, other population-level outcomes, as discussed in the text, are also shown to the right, including other regions and times where the sublineage was detected (also present in) and the number of cases detected per year (cases/year) attributable to that sublineage

