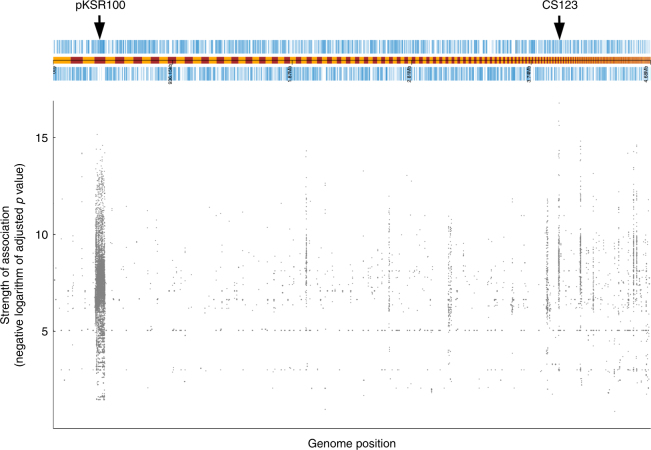
Fig. 3.
Genome-wide association analysis of MSMA sublineages. The draft genome of a S. flexneri 2a isolate (ERR1364107) is shown above, with the coding frames on forward and reverse strands of the genome appearing upper and lower to the intervening track (yellow and maroon banded), which shows the boundary of contiguous sequences. The pKSR100 contiguous sequence as well as contiguous sequence 123 (which contains sequence elements of marginally higher significance than pKSR100) are labelled. The Manhattan plot under the genome assembly shows the mapping position of sequence elements with a significant positive-association to MSMA sublineage designation, with the vertical scale representing the negative logarithm of the adjusted p value (i.e., the significance) of the association

