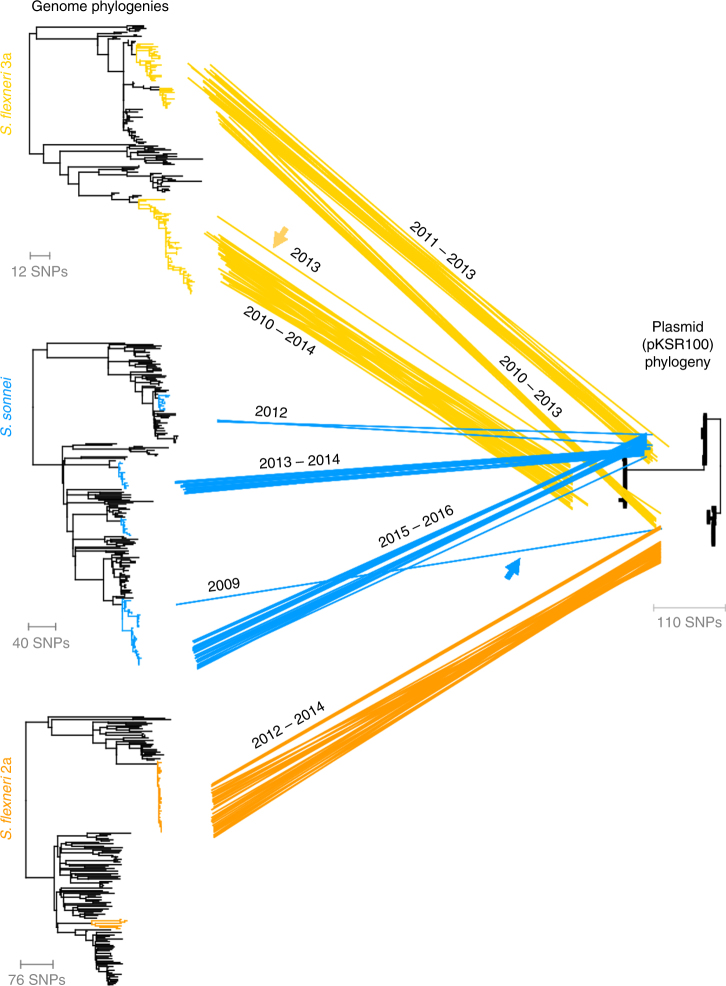
Fig. 4.
Horizontal transmission of pKSR100. Three whole-genome phylogenies for MSMA S. flexneri 3a, and S. flexneri 2a and S. sonnei are shown leftmost with successful and MSMA sublineages (respectively) highlighted in colour. The plasmid tree is a phylogeny of pKSR100 constructed from isolates containing pKSR100. Scale bars in single nucleotide polymorphisms (SNPs) are shown below each phylogeny. Individual isolate genome positions are joined to their plasmid phylogenetic position by intervening coloured lines. Two examples of horizontal transmission are indicated by arrows coloured according to the species. A time-series animation of this figure showing change over time and a static explanatory model are available elsewhere (see: Supplementary Movie 1 and Supplementary Fig. 7)

