
Fig. 2.
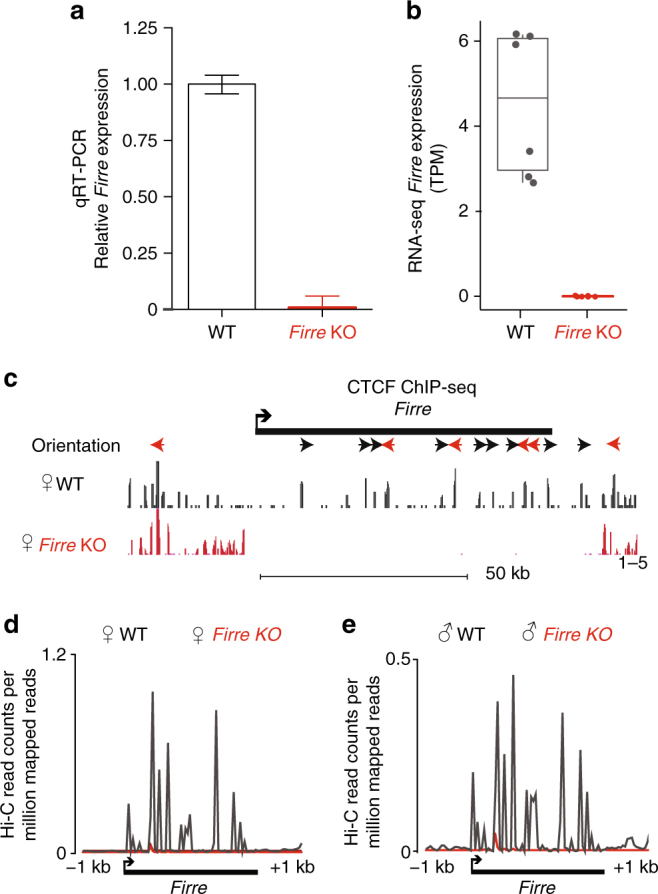
Validation of Firre knockout in MEFs. a qRT-PCR analysis of Firre expression in wild-type and knockout MEFs. Error bars: s.e.m. b Plot showing transcripts per million (TPM) values for wild-type and Firre KO MEF RNA-seq. Error bars: s.d. c CTCF ChIP-seq signal tracks showing the complete loss of CTCF binding at the Firre locus in Firre KO MEFs (mm9, chrX:47.8–49 Mb). d, e Hi-C reads per million (RPM) values for the Firre locus in (e) wild-type and (f) Firre KO MEFs